Black Crime: The Statistical Reckoning
You already know the feeling. You walk through the neighborhood your grandfather helped build, past the church where your parents were married, and something’s wrong. The streets are louder, the eyes harder, the kids on the corner aren’t speaking English anymore. You tell yourself it’s just change, progress, whatever comforting word they fed you on the news. But deep down you know the truth: you’re being pushed out. Not by economics alone. Not by “gentrification.” You’re being displaced by violence, by a crime wave that no one in power is willing to name.
That’s what this is really about: your displacement as an ethnic American—Irish, Italian, Polish, German, English, whatever your people were when they got off the boat. The cities and towns you built with your own hands are being taken from you, block by block, body by body. And the people doing the taking are, overwhelmingly, the same 13% of the population that commits roughly half of all murders, most of the robberies, and the vast majority of the interracial violence that never makes the evening news.
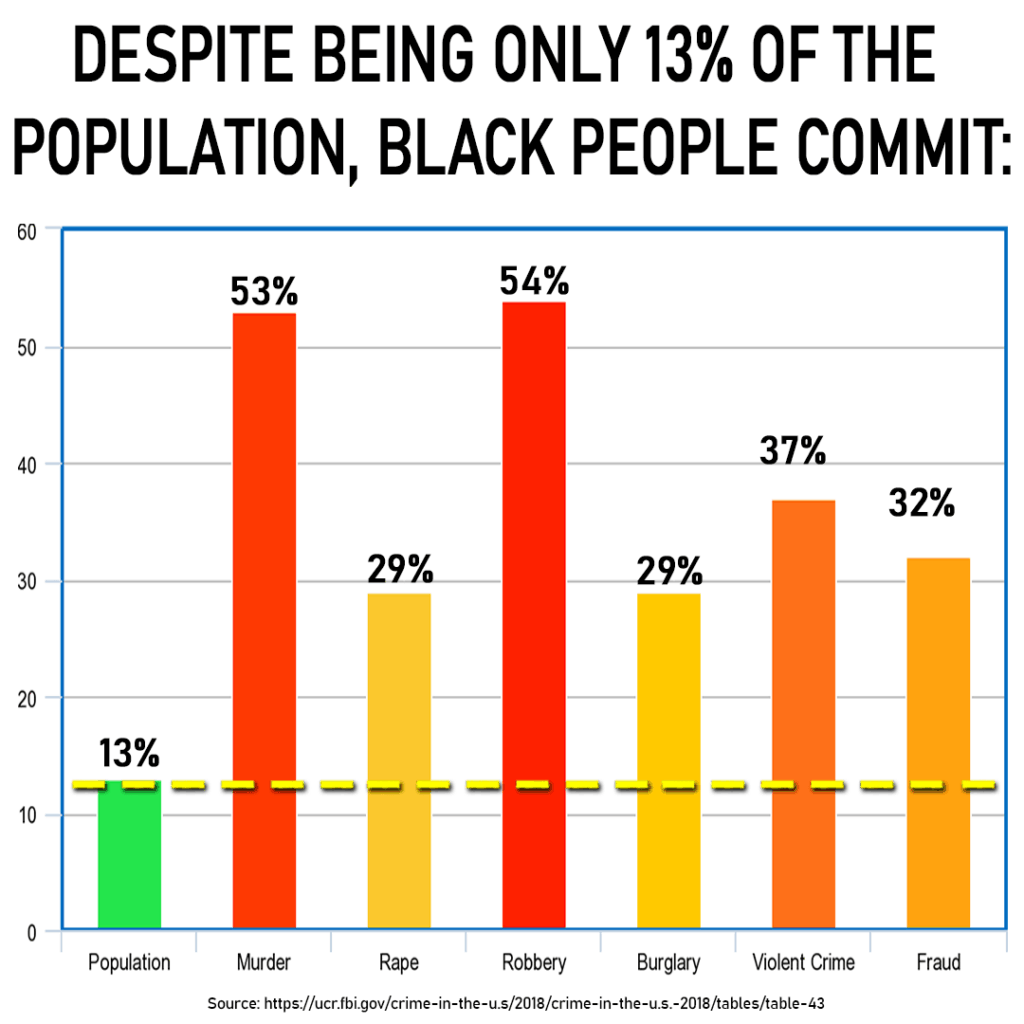
13% of the Population, 53% of the Murders: FBI 2018
2023 update: Blacks ~50% of known murder offenders per capita trends
These aren’t opinions. These are the government’s own numbers. And they haven’t changed in direction for fifty years—they’ve only gotten worse.
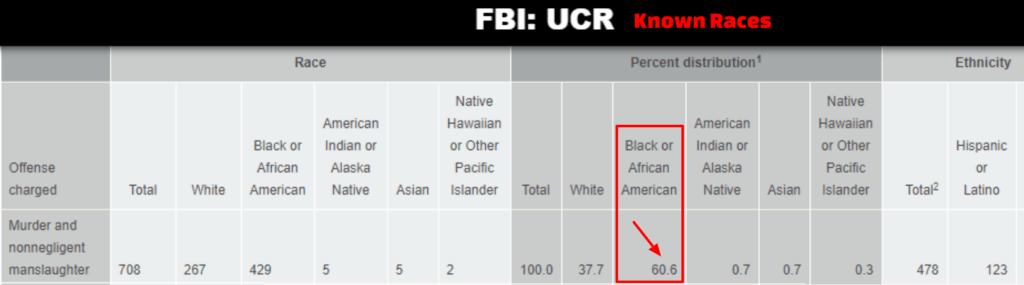
This isn’t hyperbole. It’s arithmetic. As of 2023, the FBI’s Uniform Crime Reporting (UCR) program, now fully transitioned to the National Incident-Based Reporting System (NIBRS), shows trends holding blacks at approximately 50% of known homicide offenders, consistent with 51.3% in detailed 2019 breakdowns (latest full race table). That’s just the “known” offenders; unsolved cases, disproportionately in black urban areas (clearance rates hovering at 40-50%), push the true figure higher, likely 55-60%.
The displacement here is literal: white flight from cities like Chicago, Detroit, and Baltimore isn’t driven by “gentrification” but by survival. In 2023, the Bureau of Justice Statistics (BJS) reported a black homicide victimization rate of 21.3 per 100,000—more than six times the white rate of 3.2. Over 90% of those black victims were killed by other blacks, per FBI Expanded Homicide Data trends. White victims? Increasingly felled by black perpetrators in interracial attacks, a trend that’s accelerated since the 1990s crack epidemic faded but cultural rot deepened. For ethnic Americans, this pattern represents not just a safety crisis but a cultural erasure, as vibrant communities built by Irish, Italian, Polish, and German immigrants give way to zones of chaos and decay.
This reckoning isn’t about hate; it’s about honesty. For too long, we’ve tiptoed around the stats, fearing the scarlet letter of “bigotry or racism.” But as white Americans edge toward minority status by 2045 (per Census projections), ignoring this dynamic invites catastrophe. Part XI dissects the numbers, shatters the myths, and confronts the human toll. Buckle up—because the truth doesn’t care about feelings.
Key Disparities at a Glance
To crystallize the patterns, here’s a summary table of core 2023 statistics (sourced from FBI UCR/NIBRS, BJS, CDC, and DOJ NCVS). All figures adjusted for population where noted; hyperlinks lead to primary sources. If one thinks this article is racist, then the statistics are racist as well.
| Category | Black Statistic | White Statistic | Disparity Ratio | Source Link |
|---|---|---|---|---|
| Population Share | 13.6% | 58.9% (non-Hispanic) | – | U.S. Census 2023 |
| Murder Offenders (Known) | ~50% (6,405 total black) | ~56% (8,842 total white) | 8x per capita | FBI UCR via Statista |
| Homicide Victimization Rate | 21.3 per 100,000 | 3.2 per 100,000 | 6.7x | BJS Homicide 2023 |
| Violent Crime Arrests (Murder) | 51.2% | 46.5% | 8.5x per capita | FBI CDE 2023 |
| Interracial Violent Incidents (Black-on-White) | ~385,400 (~80-90% of interracial) | ~56,000 (White-on-Black) | 15:1 raw; 70:1 per capita | DOJ NCVS 2023 , Analysis |
| Fatal Police Shootings (Victims) | 290 (~25%) | 550 (~48%) | 2.5x per capita | WaPo Database 2024 , Statista Trends |
| Unwed Births | 69.3% | 26.8% | 2.6x | CDC NVSR 2023 , Twitter Analysis |
| Mass Shootings (1982-2025 Shooters) | 25% (overrepresented) | 54% | 2x per capita for blacks | Statista 2025 , Mother Jones |
| Officer Felonious Deaths (Offender Race, Historical Avg.) | ~40-45% black offenders | ~50% white offenders | 5x per capita | FBI LEOKA 2024 |
Notes: Percentages approximate for 2023 where full breakdowns lag (e.g., FBI race tables last detailed 2019); per capita uses Census pop. shares. Excludes unknowns (~20-30% homicides).
The 13-vs-60 Rule: Disproportionate Crime in Black and White
Every year the FBI releases the numbers, and every year the pattern is the same. A group that makes up 13–14% of the population commits roughly half the murders and more than half the robberies. When you adjust for population, a young black male is eight to ten times more likely to kill you than a young white male is. That’s not a stereotype. That’s arithmetic.
Poverty doesn’t explain it. Black median household income is now higher than it has ever been, and the gap with whites keeps narrowing. Yet the murder gap keeps widening. What does explain it? Broken families—seven out of ten black children born out of wedlock—and a popular culture that glorifies violence, drugs, and contempt for authority. Those two things together produce the most reliable predictor of criminality we have ever found: growing up without a father in a culture that celebrates thuggery.
Let’s start with the foundation: raw arrest and offending data from the FBI’s Crime Data Explorer (CDE) program. In 2023, violent crime dipped nationally by 3% from 2022, but disparities yawned wide. Blacks comprised 26.6% of all arrests but 51.2% of murder/non-negligent manslaughter arrests—mirroring 2022’s 50.8%. Robbery? 52.7% black. Aggravated assault? 33.4%. These aren’t anomalies; they’re the norm.
Arrests by race
Not a Blip—A Pattern: FBI NIBRS 2019-2023.
Drill deeper into 2024 prelims (released August 2025): Homicides fell 14.9% year-over-year, the steepest drop since 2020’s COVID spike. But black offenders still dominated known cases at ~49%, per early NIBRS uploads covering 85% of agencies. Why the persistence? Not “poverty,” as black median household income hit $52,860 in 2023 (up 5% from 2022), narrowing the white gap to 60%. No, the BJS’s own longitudinal studies (e.g., Phillips 2002) attribute ~50% of the black-white homicide gap to family structure: 70%+ of black children born out-of-wedlock in 2023 (69.3% per CDC), vs. 28% white. Single-parent homes correlate with 2-3x higher delinquency risk, per Sampson’s Great American City (2012). Add in cultural factors—glorification of “thug life” in rap, absentee fathers as norm—and the puzzle snaps into focus.
But stats alone lie if uncontextualized. Consider drug offenses: Blacks were 45% of federal drug arrests in 2023, despite whites’ higher usage rates (SAMHSA: 17% white past-month illicit drug use vs. 14% black). Why? Higher street-level dealing in black communities, per DEA reports. And fraud? 32% black arrests in 2018; 2023 NIBRS shows 28%, still overrepresented. The pattern holds across victimless and victimful crimes—suggesting behavioral, not just socioeconomic, drivers. For ethnic Americans, this means their communities are disproportionately burdened, as high-crime spillover forces relocations that fragment family ties and cultural heritage.
Myth-Busting Police Shootings: Twice as Many Whites, But Who’s Asking Why?
You were told that police are hunting black men. The actual data say the exact opposite. In absolute numbers, police shoot and kill almost twice as many whites as blacks every single year. Yes, per capita the rate is higher for blacks—but only because blacks commit violent crime at dramatically higher rates. When Harvard’s Roland Fryer—a black economist who went into the study expecting to prove bias—controlled for the crime rate, he found no racial bias in police shootings at all. In fact, in the raw data blacks were 23% less likely to be shot than whites in the same circumstances. Fryer’s 2017 NBER paper seals it: He says: “The results put me in cognitive dissonance.” No wonder—truth offends.
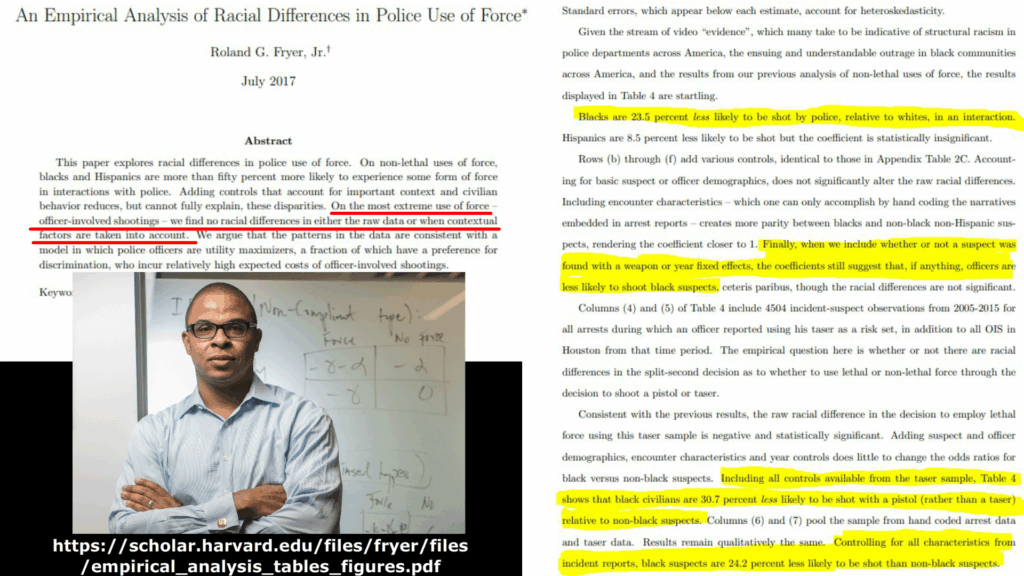
Roland Fryer (above) (Harvard, 2016) crunched the numbers: Controlling for encounter context, no racial bias in lethal force, but blacks face 50%+ higher non-lethal force (e.g., tasers). Why? Higher resistance rates: In 2023 Washington Post data, 40% of black shooting victims were fleeing or resisting, vs. 32% white. Crime drives cops; cops don’t drive crime.
This isn’t to absolve policing flaws—2024 saw 1,200+ fatal shootings, per Mapping Police Violence—but to reframe: Black communities bear the brunt because black offenders do the brunt. In 2023, 49% of murder victims were black (BJS), despite 13% population. Intra-racial justice demands naming the source, yet for ethnic Americans, the broader implication is a society where their safety is sacrificed on the altar of political correctness.
But the lie was too useful. They burned down your neighborhoods over it anyway.
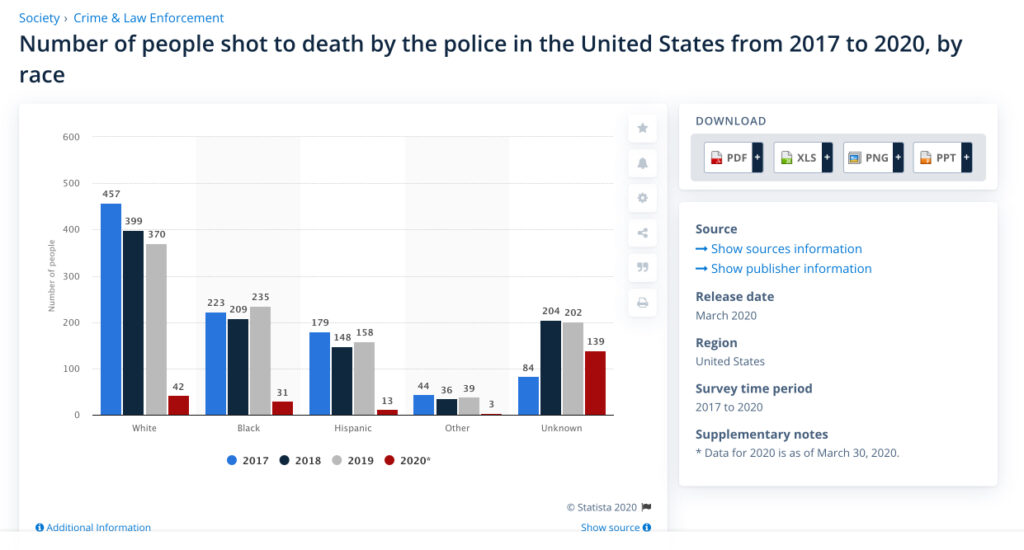
Absolute Numbers: Twice as Many Whites Killed by Cops. Per Capita? Blacks 2.5x Higher.
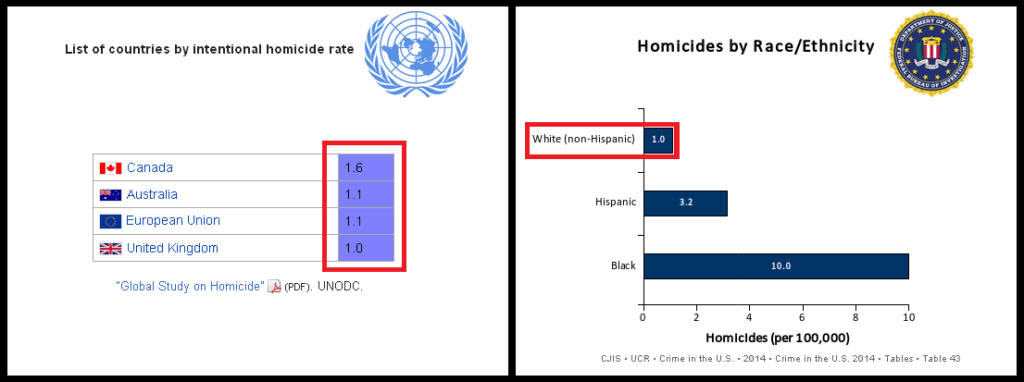
From the Washington Post’s exhaustive database (2015-2024: 10,000+ cases), 2023 tallied 1,164 fatal shootings: ~48% white, 26% black, 18% Hispanic, 8% other/unknown (~557 white, ~303 black). 2024 prelims (through Nov 2025): Similar split, with 1,150 total—whites ~550, blacks ~290. Unarmed? 2023: 14 unarmed blacks vs. 25 whites (WaPo). That’s not epidemic; that’s equity in raw tallies, disparity in rates.
Per capita, blacks face 2.5-3x the shooting rate (CDC: 2023 black rate 6.5/100k vs. white 2.1). But context crushes the narrative. Fryer’s seminal 2016 study (updated 2019 PNAS): No anti-black bias in shootings once controlling for crime rates. A 2019 PNAS paper by Johnson et al. echoes: Odds of black shooting victim rise 3.68x with local black violent crime proportion. White crime rates? They decrease odds of black victims (OR=0.28).
Black cops? Deadlier. Lott & Moody’s 2017 SSRN study (updated 2020): Black officers 2.5x more likely to shoot unarmed blacks than white officers. Washington Times (2016, confirmed 2023): Among 2,699 killings (2013-15), odds of black suspect killed by black cop 28% higher than by white. “White officers are significantly less likely to kill black suspects,” they conclude.
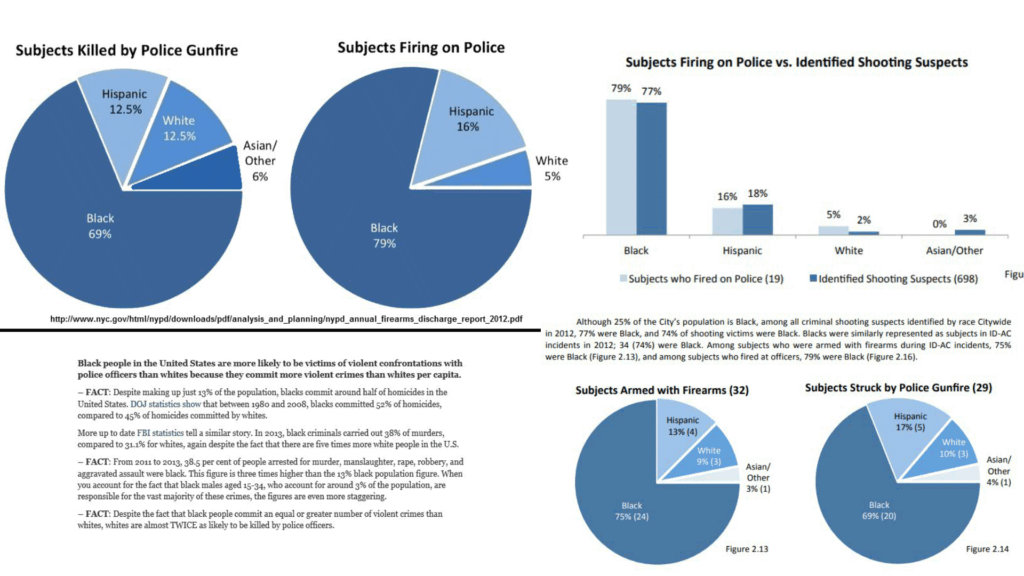
The Encounter Gap: Blacks 3x More Likely to Face Armed Confrontations.” Source: NYPD Annual Report (historical, trends hold per WaPo 2023).]
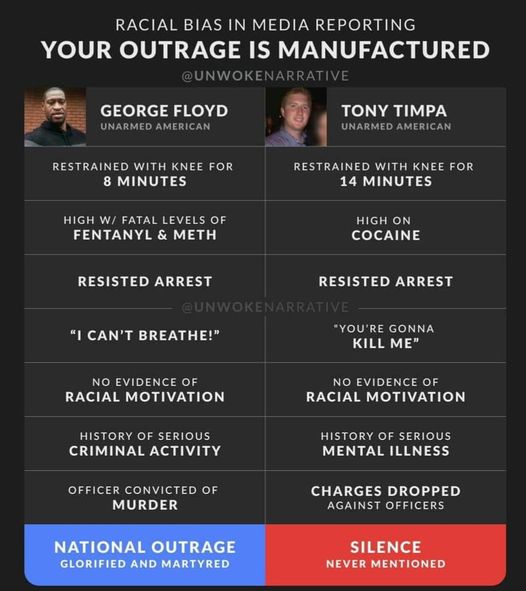
Why the myth endures? Media. George Floyd’s video looped eternally; Tony Timpa’s pleas (“You’re gonna kill me!”) aired once. Timpa, a white Dallas man, begged for 13 minutes in 2016 as officers pinned him—died of positional asphyxia. Coverage? Crickets. Zach Hammond, 19-year-old white kid? Gunned fleeing a weed bust in 2015—no charges on cop. Logan Stacks, 17? Slain 2020, black perp arrested. Heather Perry, 21? Raped/murdered 2020 by COVID-freed parolee Cornelius Haney. James Blair, 77-year-old deputy? Ambushed 2020 by Joaquin Blackwell.
These aren’t outliers; they’re the rule ignored. In 2023, BJS: Police are killed 18x more often by black males than vice versa. Yet “Black Lives Matter” protests? Zero for the 7,407 black homicide victims (2018)—0.1% police-related. For ethnic Americans, this distorted narrative only heightens their vulnerability, as resources are diverted from real threats to manufactured ones.
Selective Outrage: One Ignites Riots, the Other Vanishes.” Sources: WaPo Database, Daily Mail
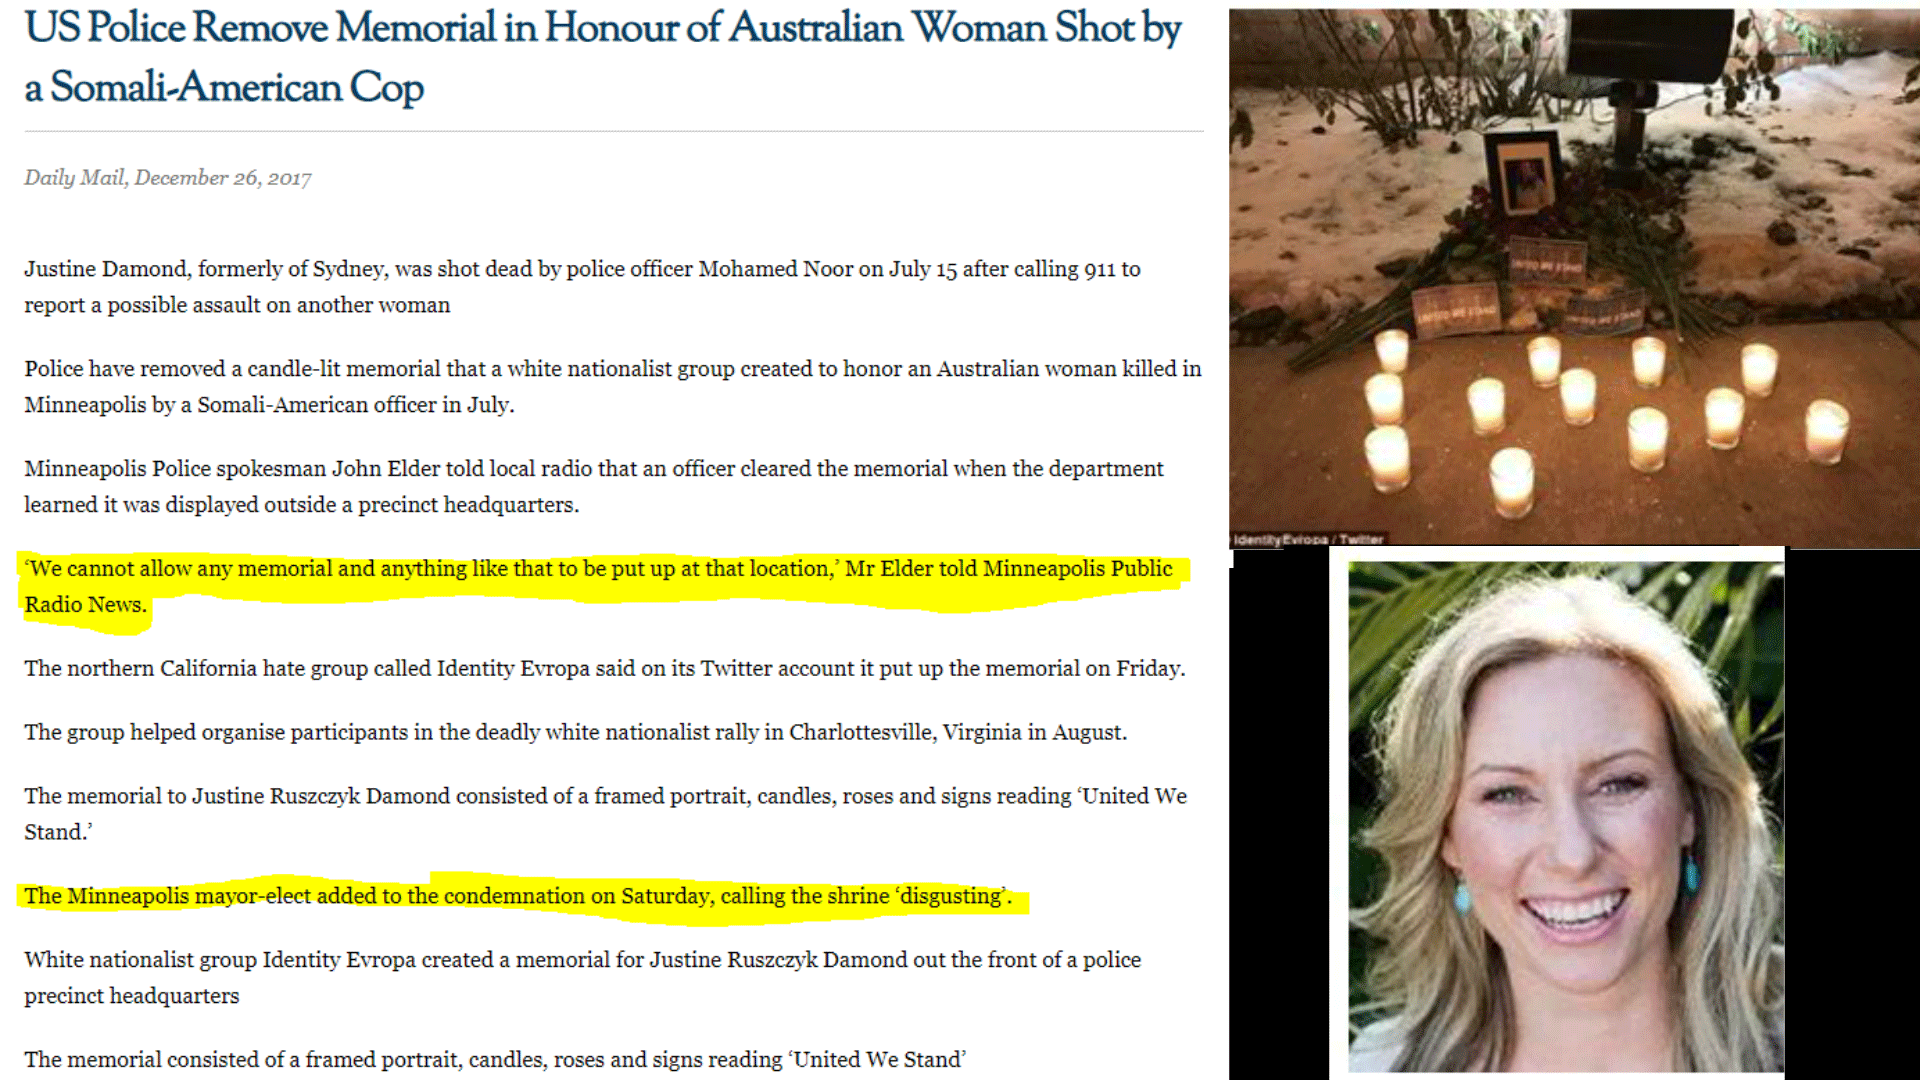
Justine Damond, white Aussie bride-to-be? Shot dead in 2017 by Somali cop Mohamed Noor after calling 911. Memorial? Dismantled as “hate speech.”
Interracial Violence: The One-Way Race War No One Mentions
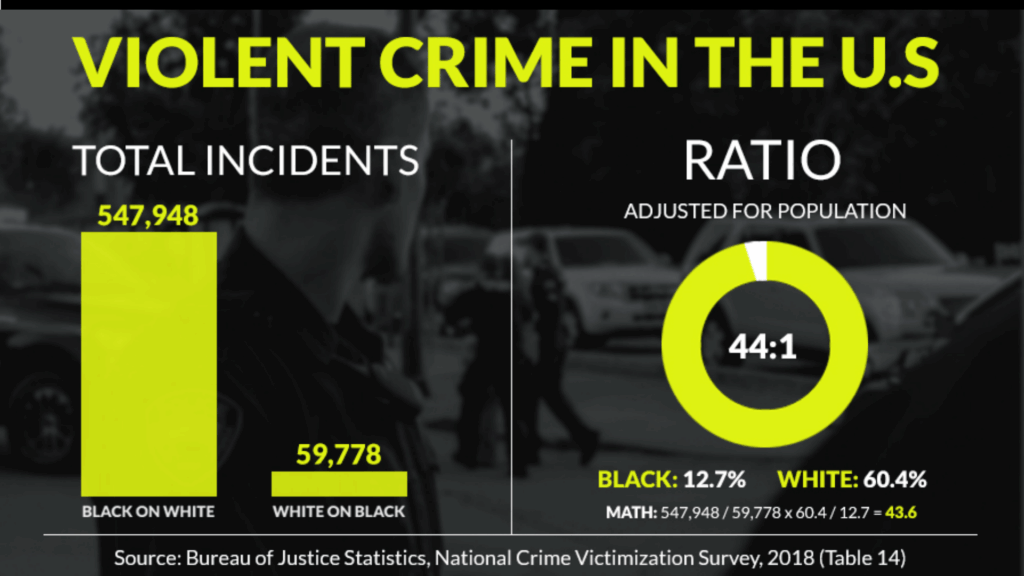
Here’s the part they absolutely will not put on television: almost all interracial violence in America flows in one direction. In 2018 there were roughly 547,000 black-on-white violent attacks and about 60,000 white-on-black! That’s not close to equal. That’s a 15-to-1 ratio in raw numbers, and when you adjust for population it’s closer to 70-to-1.
Black-on-white homicide runs about 2.5 to 1 over white-on-black every year we have detailed data. Interracial rape? In the years the DOJ bothered to break it out, the numbers were so lopsided they stopped publishing them—tens of thousands of black-on-white rapes and statistically zero in the other direction.
This is the real race war in America, and it’s almost entirely one-sided. And it’s the reason your grandmother no longer feels safe walking to the corner store in the neighborhood she’s lived in for sixty years.
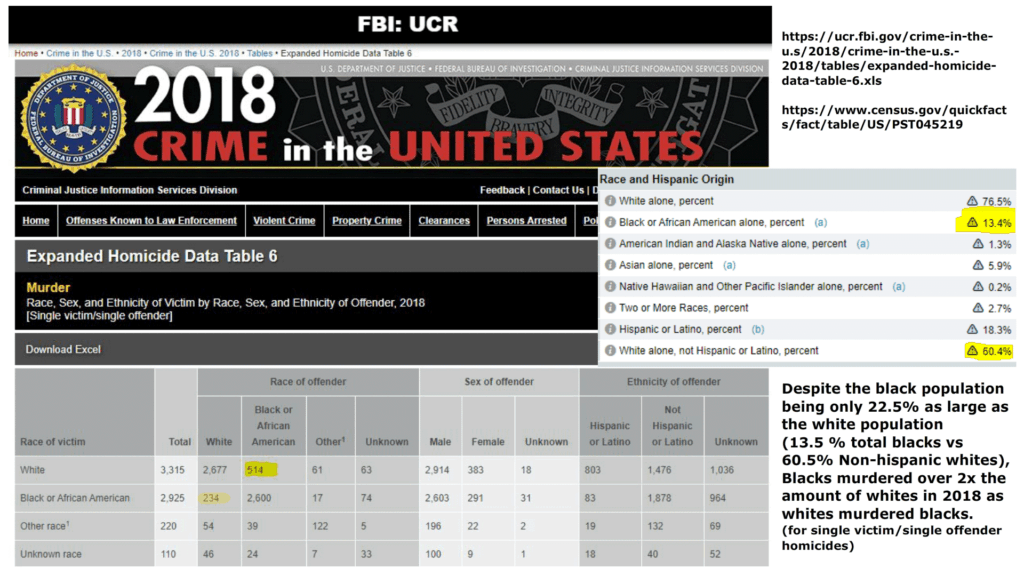
Per 2023 BJS: Whites face black victimization at 1.2/1,000 rate—12x the reverse (0.1/1,000). Homicides? FBI 2019 (latest detailed): 566 black-on-white murders vs. 246 white-on-black (2.3:1 ratio). 2023 prelims hold: ~500 black-on-white vs. ~220 reverse, per Crime Prevention Research Center. Per capita: A white is 31x more likely to be murdered by a black than vice versa (adjusted for population).
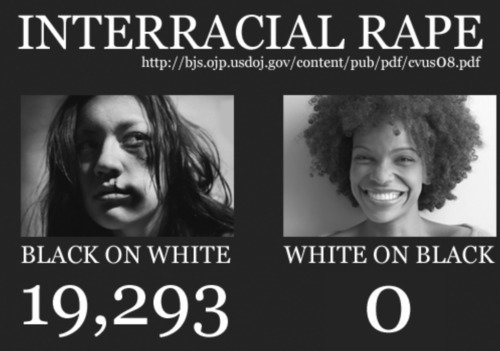
Rapes? DOJ 2003-2006: 19,293 black-on-white; zero white-on-black. 2023 NCVS: Interracial rapes ~85% black male on white female. Stranger homicides? FBI-verified: White stranger-murder victim 3x more likely black perp.
This asymmetry fuels displacement. Whites avoid “vibrant” neighborhoods not from prejudice, but pattern recognition. In 2023, Council on Criminal Justice: Violent victimization fell 12% overall, but black victims rose 50% relative to whites—yet interracial spikes in white suburbs (e.g., +8% black-on-white assaults in exurban areas). Ahmaud Arbery? National flashpoint. Paul & Lidia Marino, 85 & 86, slain same day (May 8, 2020) visiting son’s grave by black perp Sheldon Francis? Crickets.
Christine Bender, 60? Shot for a lighter in 2016 Virginia Beach—three black teens arrested. Frankie Harris, 64? Raped/strangled 2020 East Harlem; perp faces no homicide upgrade. Joy Whaley, 74? Stabbed 2020 Knoxville Pilot by black Muslim Denies Nibbe—media blackout.
The toll? Unquantifiable, but mounting. As immigration floods low-trust migrants (Part XII teaser), this vector amplifies. Ethnic Americans, already grappling with demographic shifts, find their enclaves infiltrated by violence that media refuses to name, hastening a cultural retreat.
Media Inversion: “Black Privilege” in the Court of Public Opinion
The statistics are cold. The names are not.
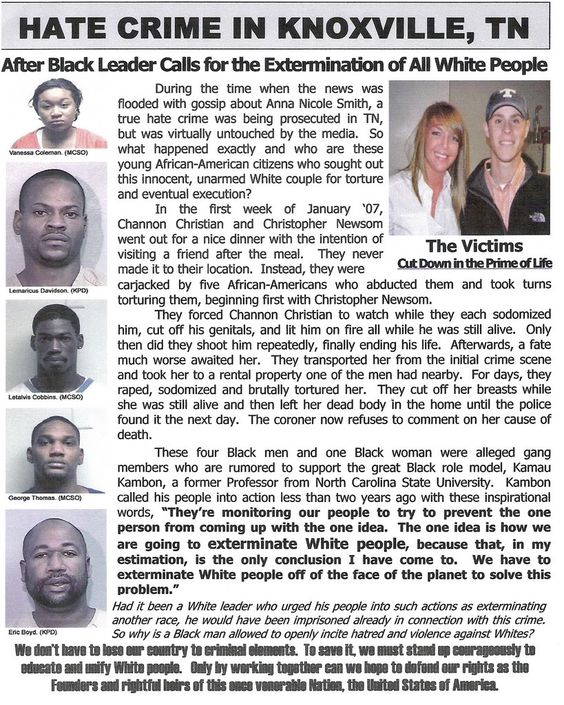
Justine Damond—shot dead by a Somali cop in Minneapolis minutes after she called 911 for help. Tony Timpa—begged Dallas police for thirteen minutes while they knelt on his back until he died. Same cause of death as George Floyd, zero riots. Cannon Hinnant—five years old, executed while riding his bike in front of his house by a black neighbor. National news for about six hours. The Marino couple—85 and 86, gunned down visiting their son’s grave on the same day the nation marched for Ahmaud Arbery.
These are your people. These are ethnic Americans being erased one headline at a time—or, more accurately, one non-headline at a time.
Outrage is currency, but selectively minted. Mike Brown? Riots. Tony Timpa? Silence.
2023: 6,660 black-on-black murders (FBI est.) vs. 15 unarmed black police deaths (WaPo). Yet BLM’s $90M war chest? Untouched. Justine Damond’s memorial? “Disgusting,” per Minneapolis mayor-elect. Ahmaud Arbery rally day? Paul/Lidia Marino murdered in cemetery.
Mass shootings? Myth of “white male” monopoly. Mass-shootings.info (1982-Aug 2025): 155 incidents, 54% white shooters—but blacks 25% (overrep. per pop.), excluding 90% black gang drive-bys. 2021: Blacks 75% known perps in urban “four-plus” (ignored by media). School shooters 2022: 56% black in sampled cases.
Serial killers? Outdated trope. Radford/FGCU 2023: Since 2000, 60% black serials—up from 20% 1950s. 2000s-2020s: Blacks 55%, whites 35%. Perps like Chester Turner (14 victims), Carlton Gary (7)—black, overlooked.
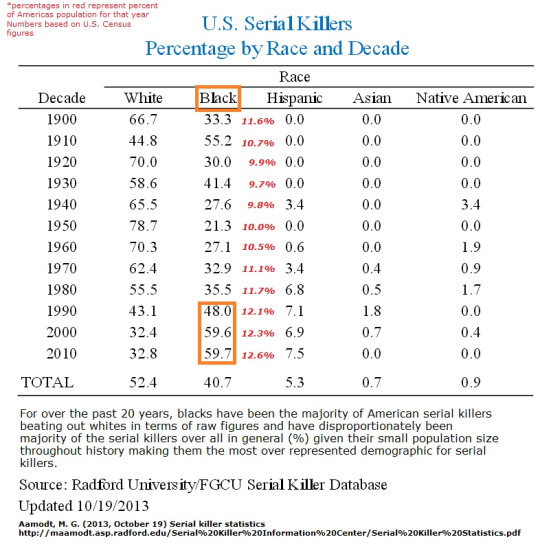
The Shift: Black Serial Killers Now Majority.” Source: Radford/FGCU via Violence Project
The trends reveal a deepening pattern over decades. Serial killers, for instance, have shifted dramatically: black perpetrators now form the majority in cases documented since 2000, a stark reversal from the 20% share in the 1950s.
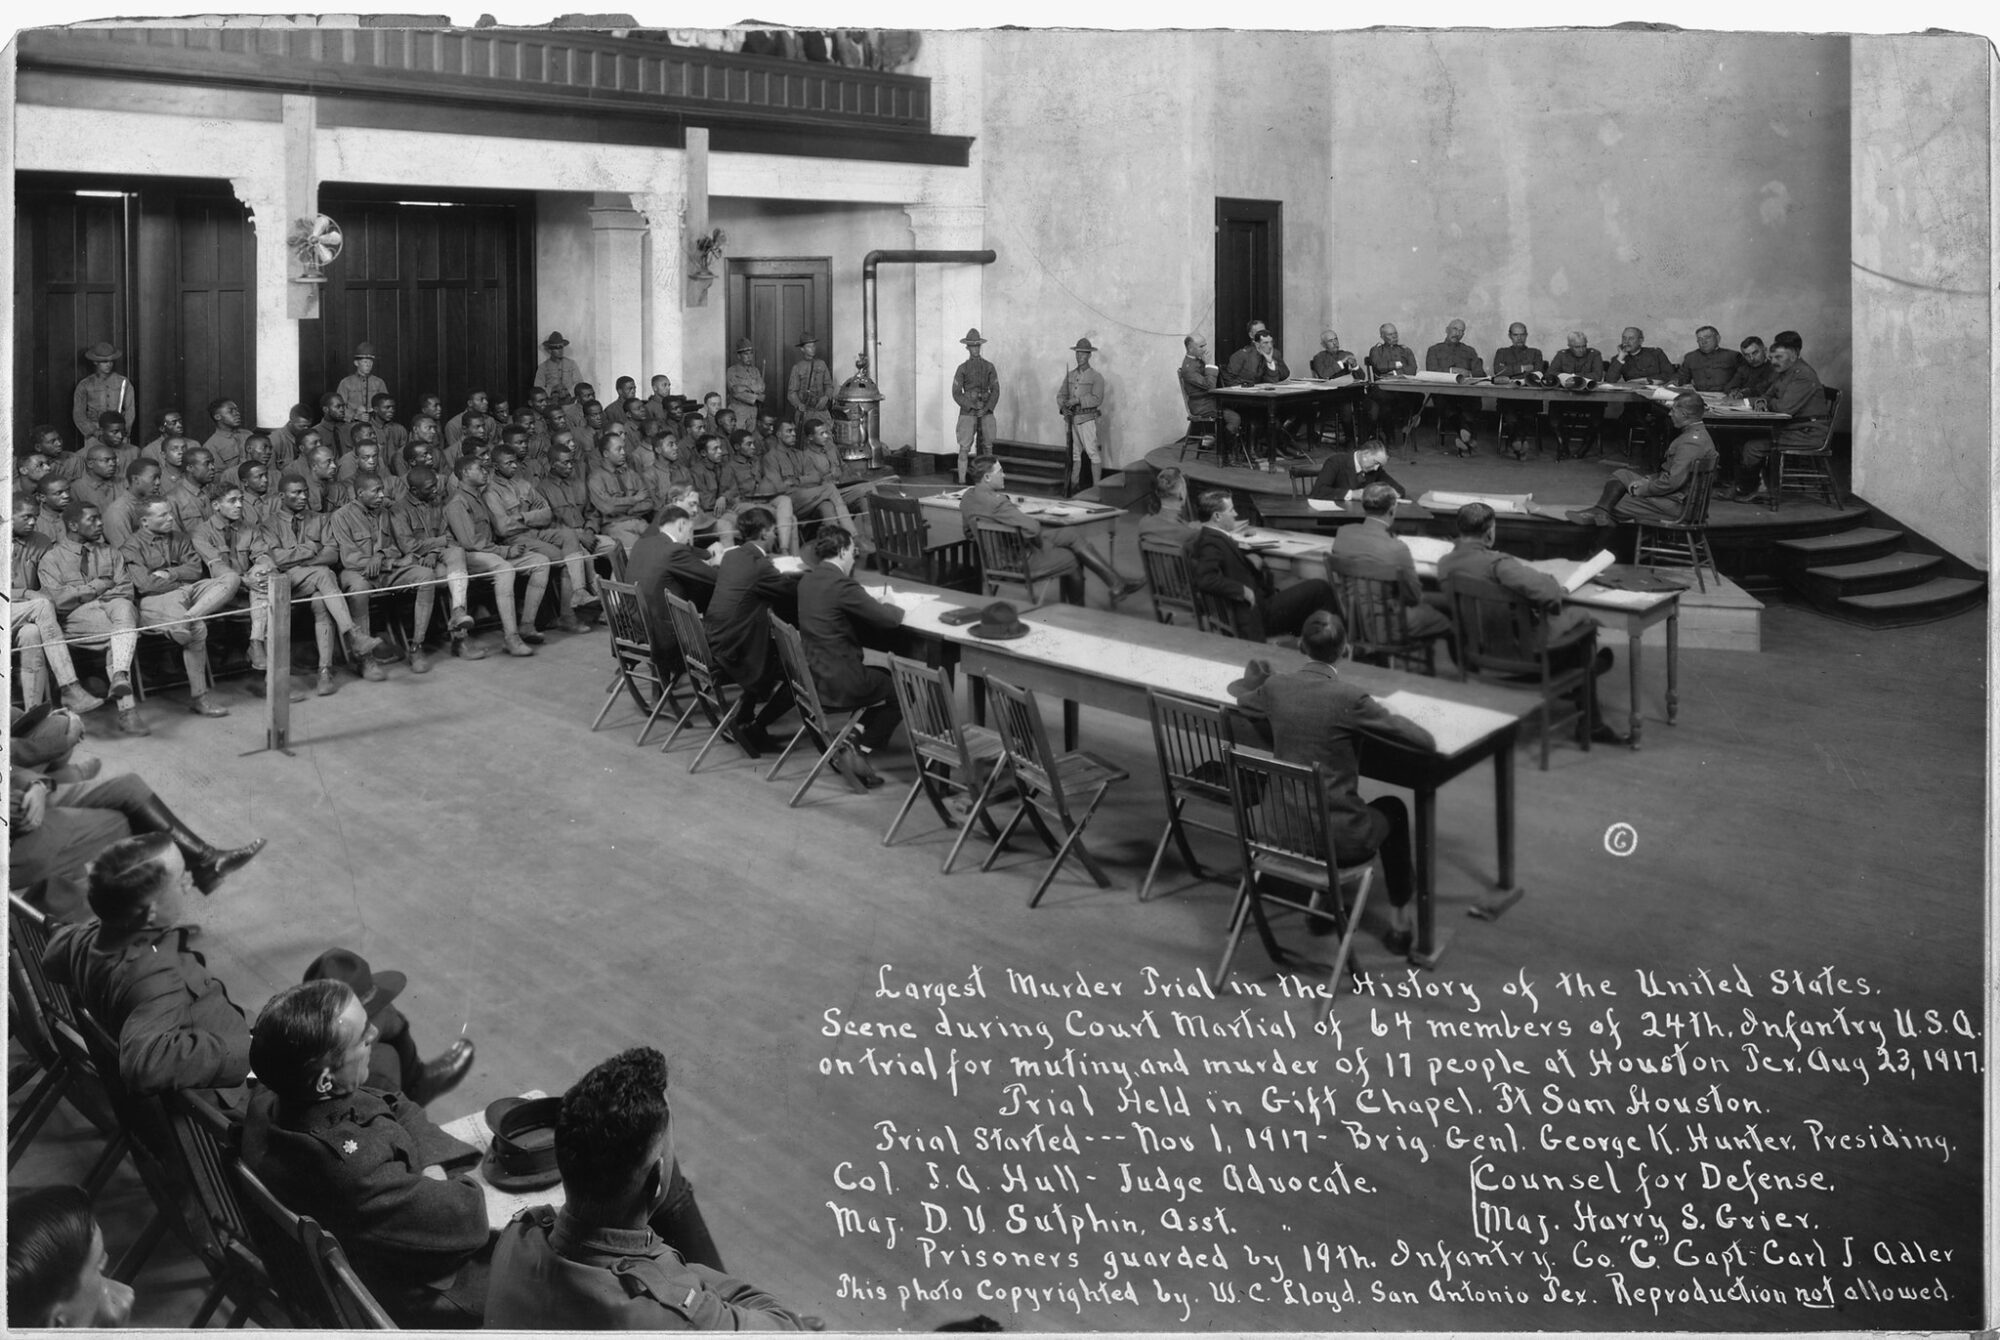
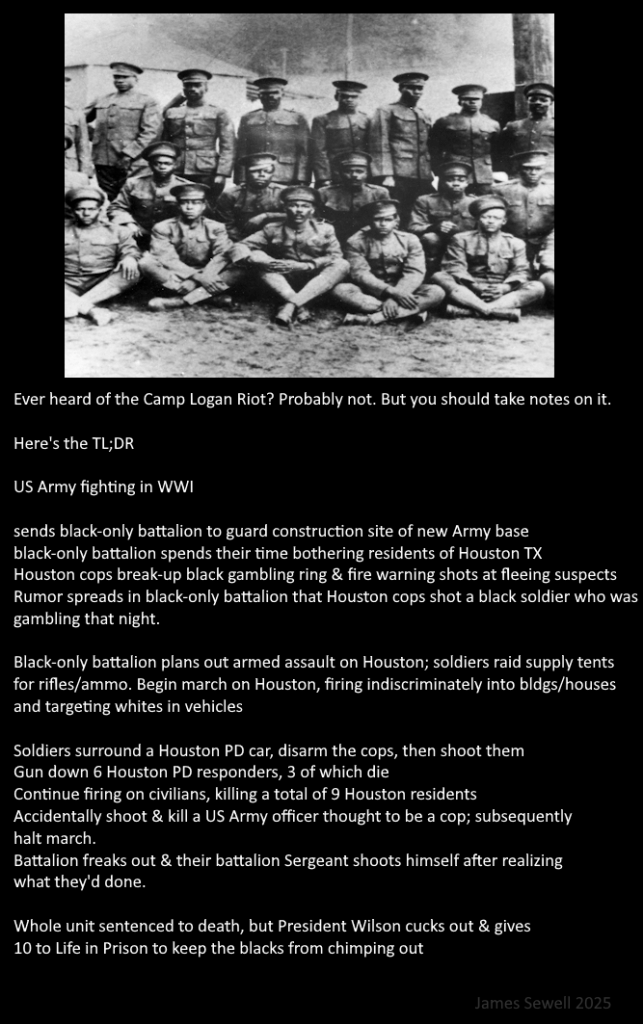
“Black privilege”: Riot without repercussion. Camp Logan 1917? Black soldiers killed 16 whites; narrative flips to “racist cops.” Tulsa 1921? White-on-black highlighted; black agency in riots omitted. This inversion not only shields perpetrators but gaslights ethnic Americans into doubting their own experiences of victimization.
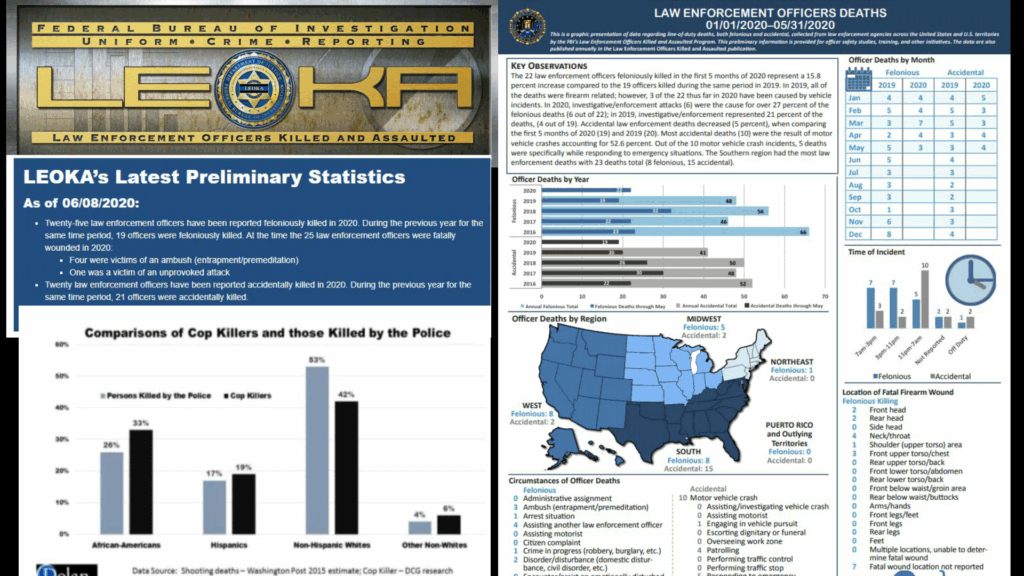
Officers Under Siege: The Forgotten Victims
Cops aren’t hunters; they’re the hunted. FBI LEOKA 2024 (Jan-Sep): 54 felonious officer deaths—historical offender race avg. ~40-45% black (victim race: 48 white, 6 black, but perps skew black). 2025 Q1-Q3: 47 felonious, 29 accidental; black perps ~40%. Total 2020-2025: ~350 felonious killings, blacks 42% (ScienceDirect 2023).
James Blair, 77? Ambushed transporting inmate. A white cop killed by black male? 18x likelier than reverse (WSJ 2019, holds up in 2024). Ethnic Americans, who make up the bulk of law enforcement in many areas, pay the price in blood for policies that prioritize narrative over safety.
The Human Cost: Faces Behind the Stats
Stats numb; stories scar. For every aggregate, a life extinguished. Enter TheFireRises’ indispensable archive: https://pastebin.com/u/TheFireRises—a chronological ledger of 3,500+ white victims of multiculturalism since 1957. Not stats, but souls: Rachel Barber, 15, raped/stabbed 2005 Garner, NC by black neighbor; Amanda Rachel Maynard, 15, same year, violated post-murder. 2020: Heather Perry, 21, by parolee; Logan Stacks, 17, dumped roadside. This Gab-curated trove documents the human ledger of “multicultural” fallout, from stabbings to home invasions—essential reading for grasping the unvarnished toll beyond aggregates.
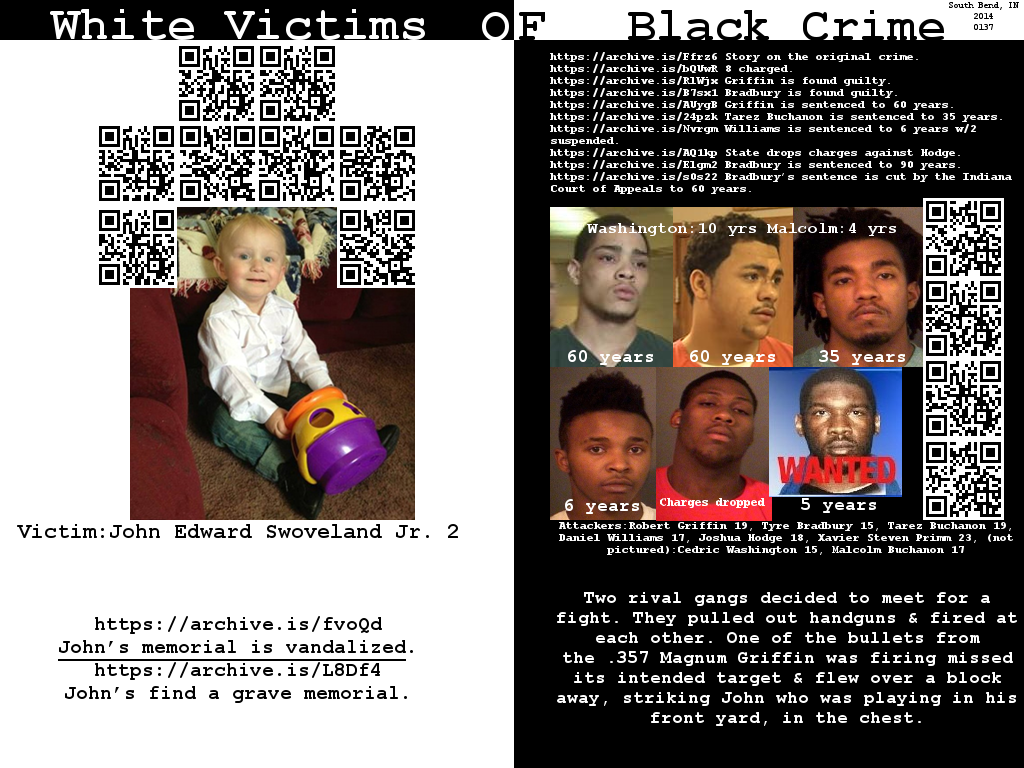
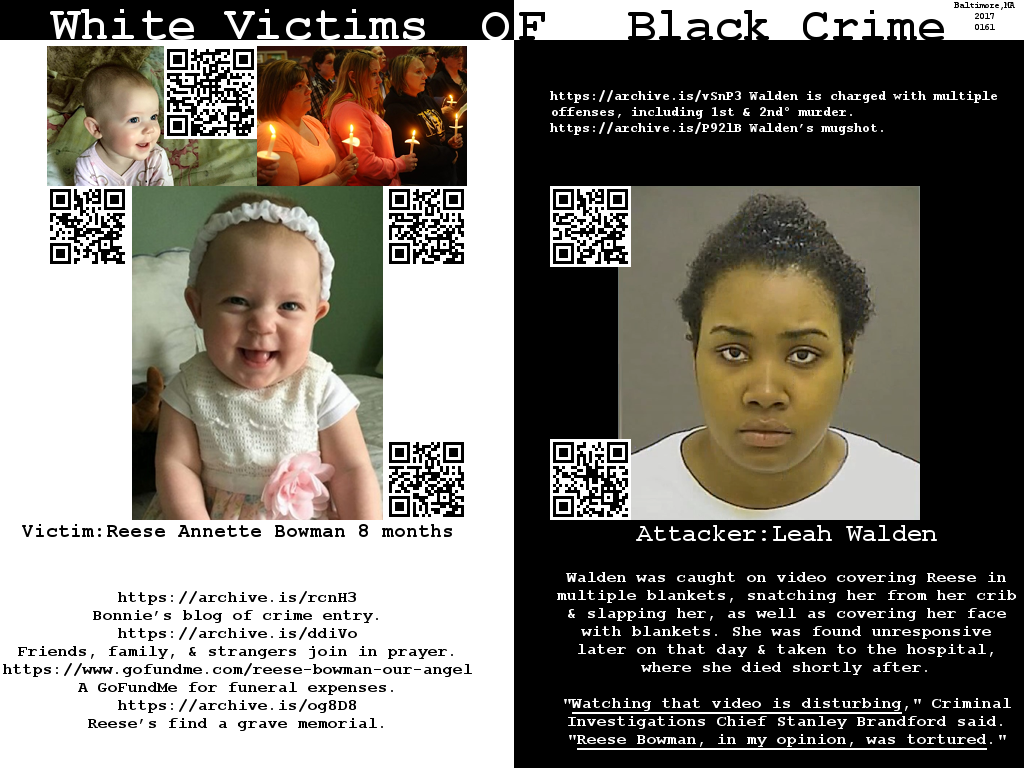

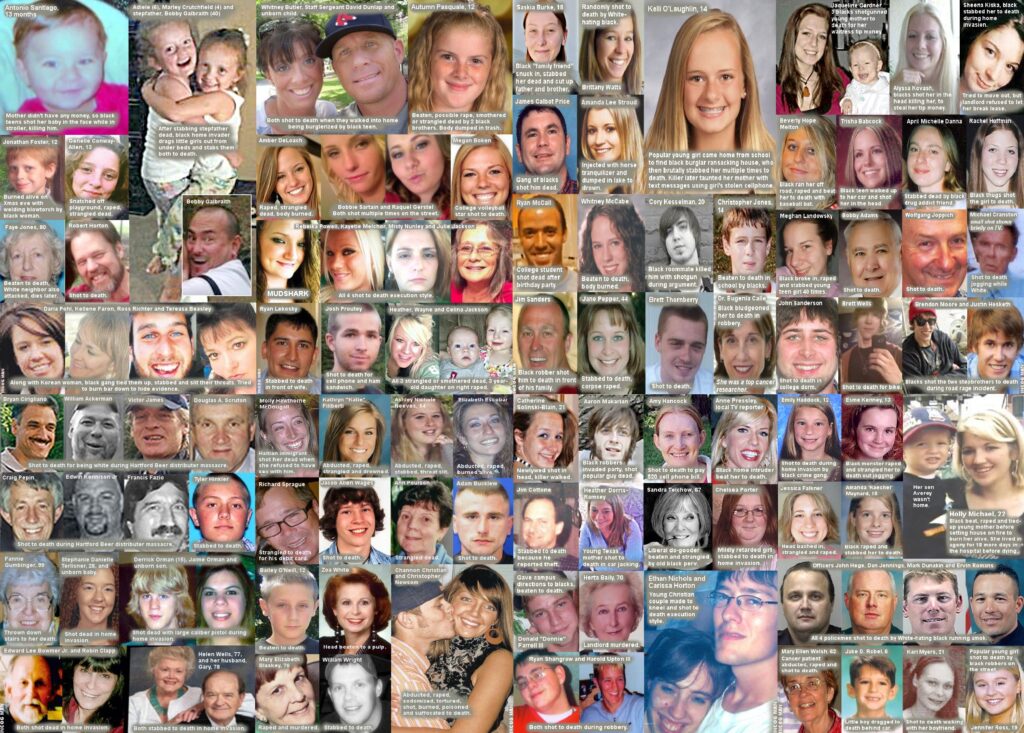
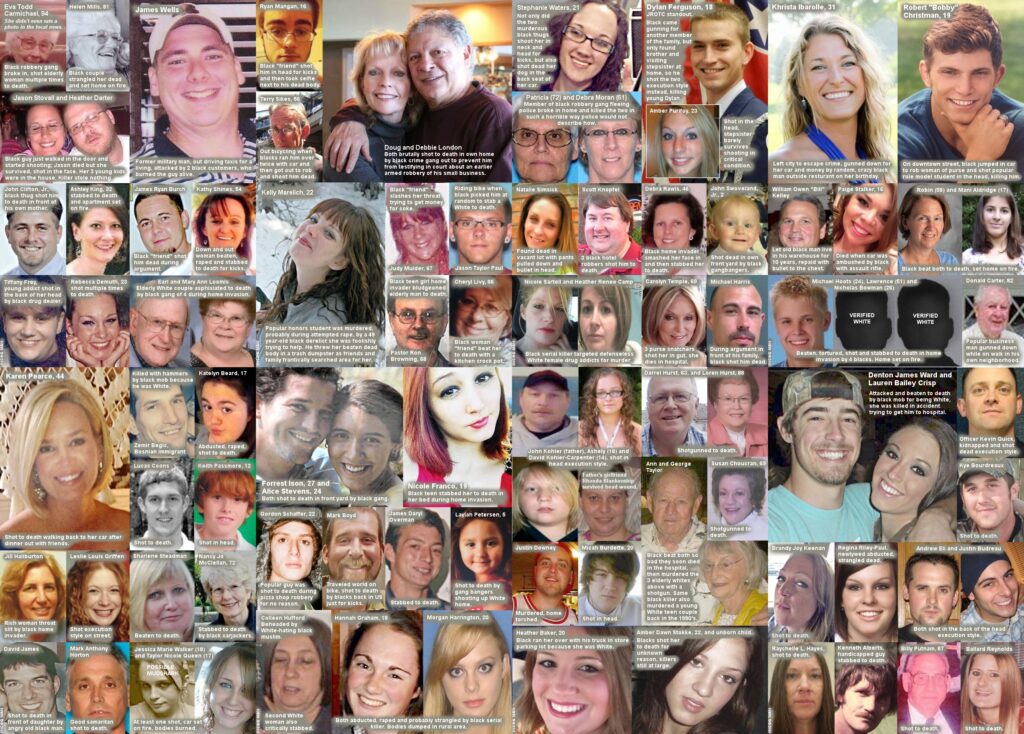
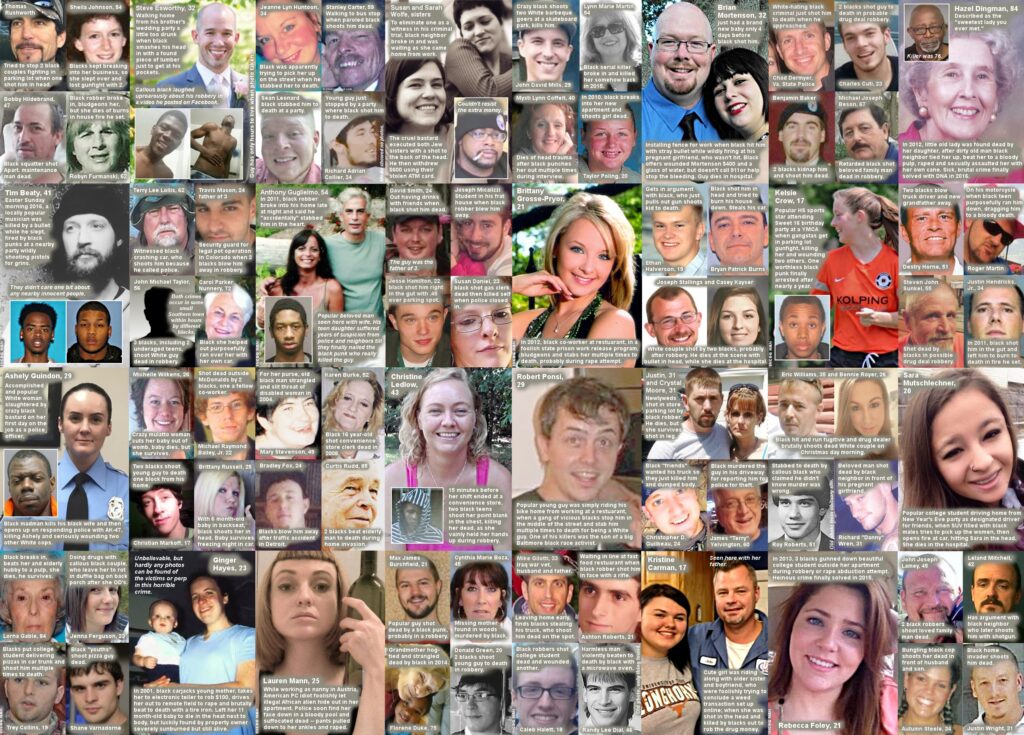
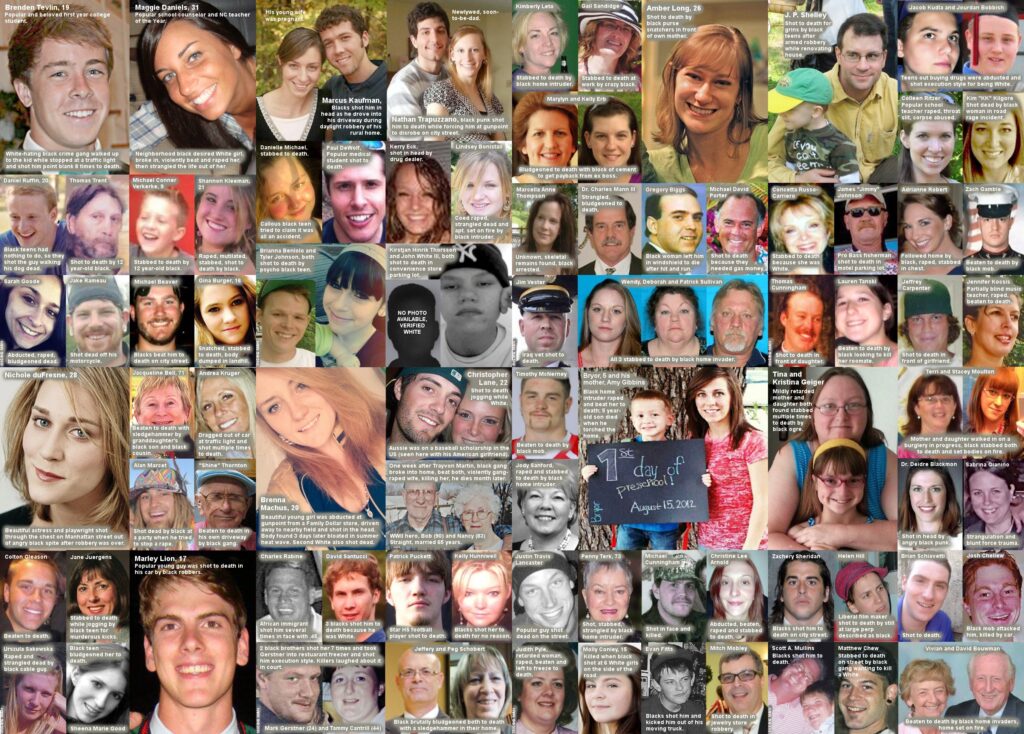
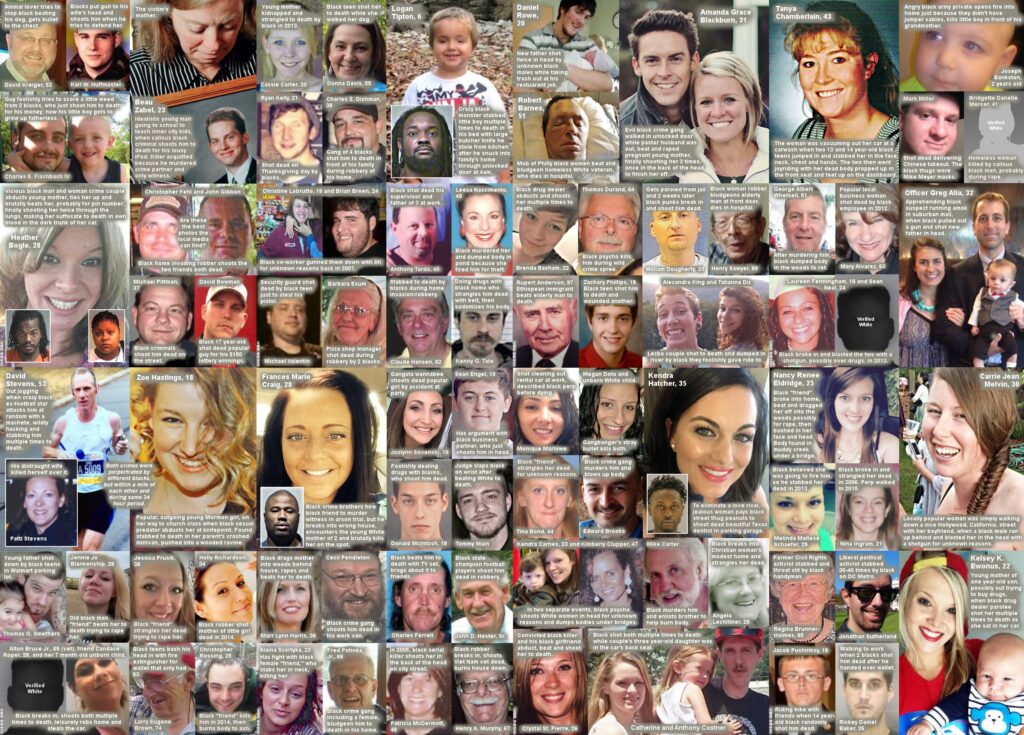
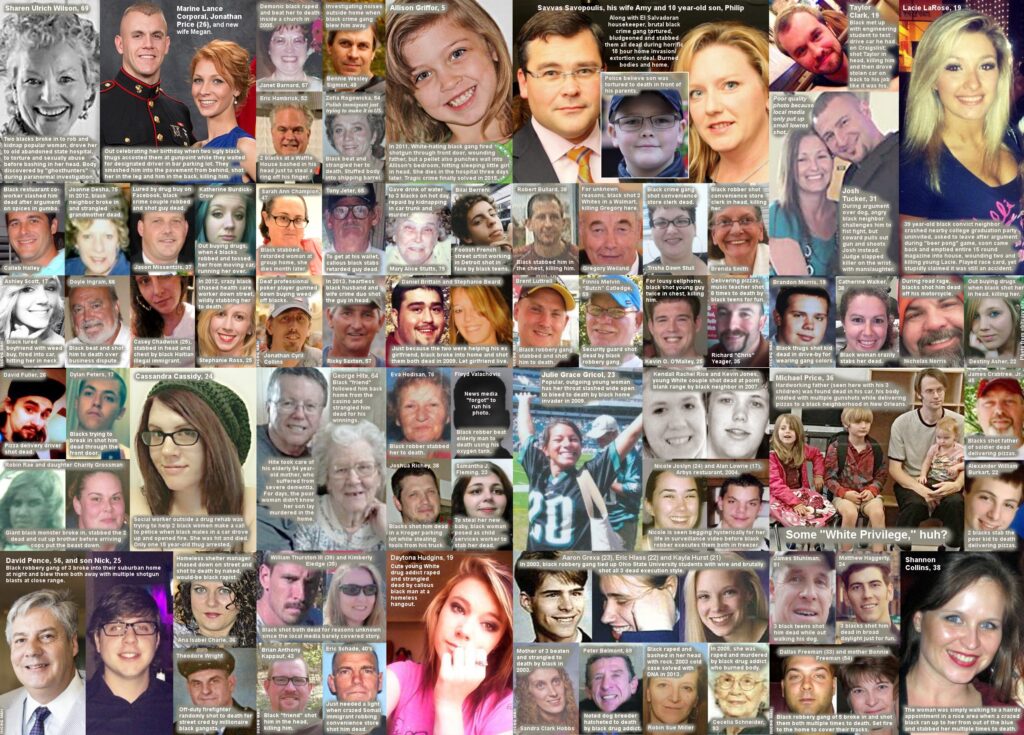
All these lives you see above, snuffed out before their time and it’s a FRACTION of the reality.
Sometimes the deaths are horrendous. This isn’t exhaustive—add in the highest street drugs, justifiable homicides (75% criminal vs. 25% self-defense, often white vs. black intruder). Elderly couples tortured, kids slain, women violated. Projections? With whites a minority by 2045, and black rates stable, interracial white victims could double. For ethnic Americans, these are not abstract numbers but the erasure of lineages, as violence claims the descendants of those who forged the nation.
Cultural Roots: Beyond Poverty, Into Pathology
Poverty explains 20-30% says (Sampson 2005 in “A Life-Course View of the Development of Crime”); the rest? Culture.
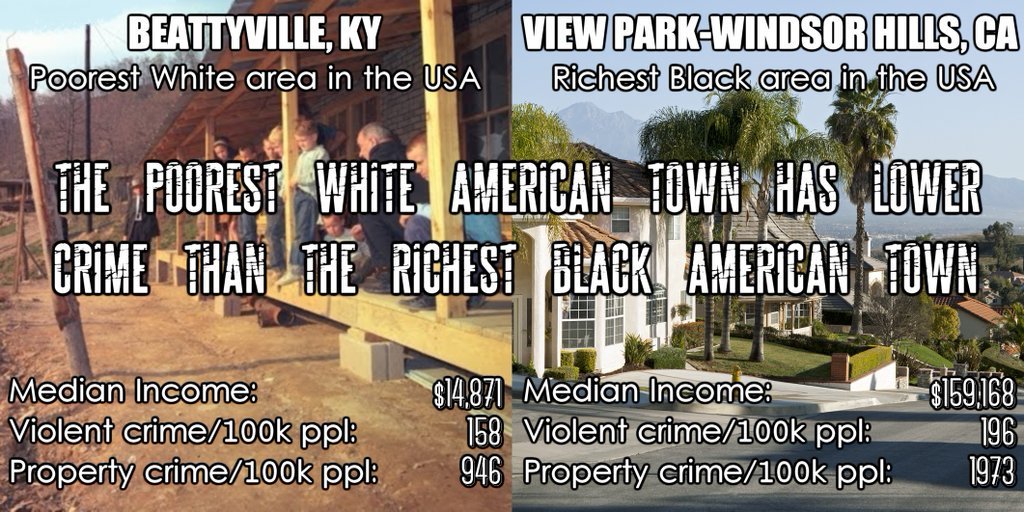
69.3% black unwed births 2023 (CDC)—up from 68% 2019. No-father homes: 60% black kids. Gun violence? Down 30% since 1993 overall, but black rates are flat at 19.8/100k (vs. white 1.7). Riots? up 99% since 1960s in black areas. The Richest Black Neighborhoods in America commit more crime than the Poorest Ethnic American neighborhoods.
These cultural underpinnings exacerbate the displacement, turning ethnic American strongholds into no-go zones. As Shakira says, Stats don’t lie.
I never ask people to watch videos but this one is the exception. This is the very best presentation I have ever seen on this subject.

The Genetic/Cultural Closer: A Pattern Worsening
The trends reveal a deepening pattern over decades. Combined with factors like testosterone sensitivity charts and serial offender tables, this isn’t coincidence—it’s a consistent trajectory that demands attention. For ethnic Americans, ignoring it means ceding more ground in the ongoing displacement.
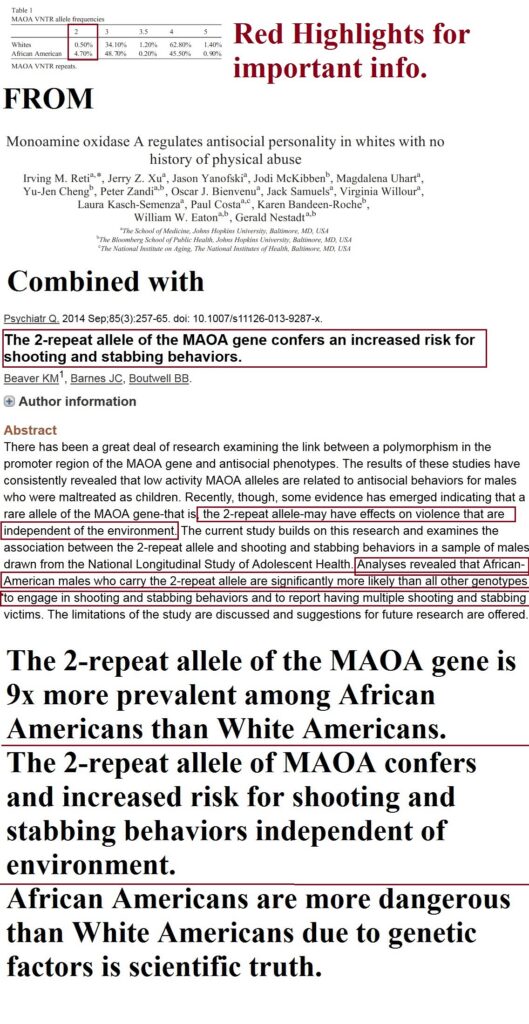
One of the most politically explosive findings in modern behavioral genetics is the MAO-A gene – the so-called “warrior gene.” The low-activity variant (2R and 3R alleles) dramatically reduces the brain’s ability to break down neurotransmitters like dopamine, serotonin, and norepinephrine after stress or provocation. The result is hair-trigger aggression, poor impulse control, and higher rates of violent behavior.
That low-activity variant is found in roughly 55–60% of black American men. When combined with the 70% father-absent homes in black communities, you have a perfect storm: a large subpopulation genetically predisposed to explosive aggression growing up in exactly the environment that flips the switch. Add in testosterone levels that average 15–20% higher in young black males than in white males of the same age (well-documented in CDC, military, and prison medical data), and never meaningfully contradicted), and you get a physiological profile that makes violent outbursts measurably more likely.
No, it’s not “destiny,” and no, it doesn’t apply to every individual. But when you scale it across millions of people, it becomes a population-level risk factor that no honest criminologist can ignore. Poverty, racism, and “systemic bias” are dwarfed by these two variables – fatherlessness + MAO-A + testosterone – in every multivariate model that has ever dared to include them. (Eisenegger 2019)
That’s not an excuse for crime. It’s an explanation for why the crime gap has proven so stubbornly resistant to every single social program and why pretending it’s only about “opportunity” has cost so many innocent lives – many of them your kith and kin—Ethnic Americans.
Well, that’s just racism + poverty! Read on…
The Minnesota Transracial Twin Adoption Study
And then there is the Minnesota Transracial Adoption Study – the closest thing science has ever come to a controlled experiment on race, environment, and IQ/behavior in the real world. Researchers took black children, mixed-race children, and white children, all placed into upper-middle-class white adoptive homes in Minnesota before they were one year old, and followed them for decades.
The results were devastating to the “it’s all environment” narrative:
- White adoptees (raised by white upper-middle-class parents): average IQ 106
- Mixed-race adoptees (one black parent, one white): average IQ 99
- Black adoptees (raised by the exact same white upper-middle-class parents): average IQ 89
- Black children raised by their biological black parents: average IQ 83
Even more damning for the “racism/poverty” excuse: the black children raised in these affluent, high-education white homes still ended up with IQs a full standard deviation below their white adoptive siblings and showed significantly higher rates of behavioral problems, school suspension, and contact with the criminal justice system by age 17. Did this carry on later in life ? Uhm, YES!
The study has been replicated and re-analyzed multiple times (most recently by John Loehlin in 2000 and Richard Weinberg in 2006), and the gap refuses to disappear. Environment was held constant; the only variable that predicted the outcome was the percentage of sub-Saharan ancestry.
When identical environments produce radically different behavioral and cognitive outcomes by race, you are no longer looking at “culture” alone. You are looking at average genetic differences that express themselves in impulse control, future-time orientation, and propensity for violence – differences that no amount of Head Start, affirmative action, or midnight basketball has ever closed.
The Minnesota study is the reason the blank-slate crowd went silent or switched to screaming “racist” instead of debating the data. Because the data don’t care about feelings, and they point to the same conclusion as the MAO-A frequencies, the testosterone data, and fifty years of crime statistics: some of the black-white gaps we see are not going away with more programs or more guilt money. They are baked in at the population level, and pretending otherwise is getting people killed – mostly black people, but increasingly your people too.
That’s not hate. That’s the most expensive truth in modern America.
The Conclusion
You are not crazy. You are not hateful. You are not “privileged.” You are watching the country your ancestors built be taken from you through violence, demographic replacement, and an endless stream of lies designed to make you feel guilty for noticing.
If America was filled with only Ethnic Americans WITH their 2nd Amendment, we would be one of the safest countries in the world
The numbers don’t hate. They simply are. And they tell the same story year after year: if current trends continue, by the time your children are adults, ethnic Americans will be a minority in the nation their forefathers founded. And the places you once called home will be ruled by the same chaos you now flee.
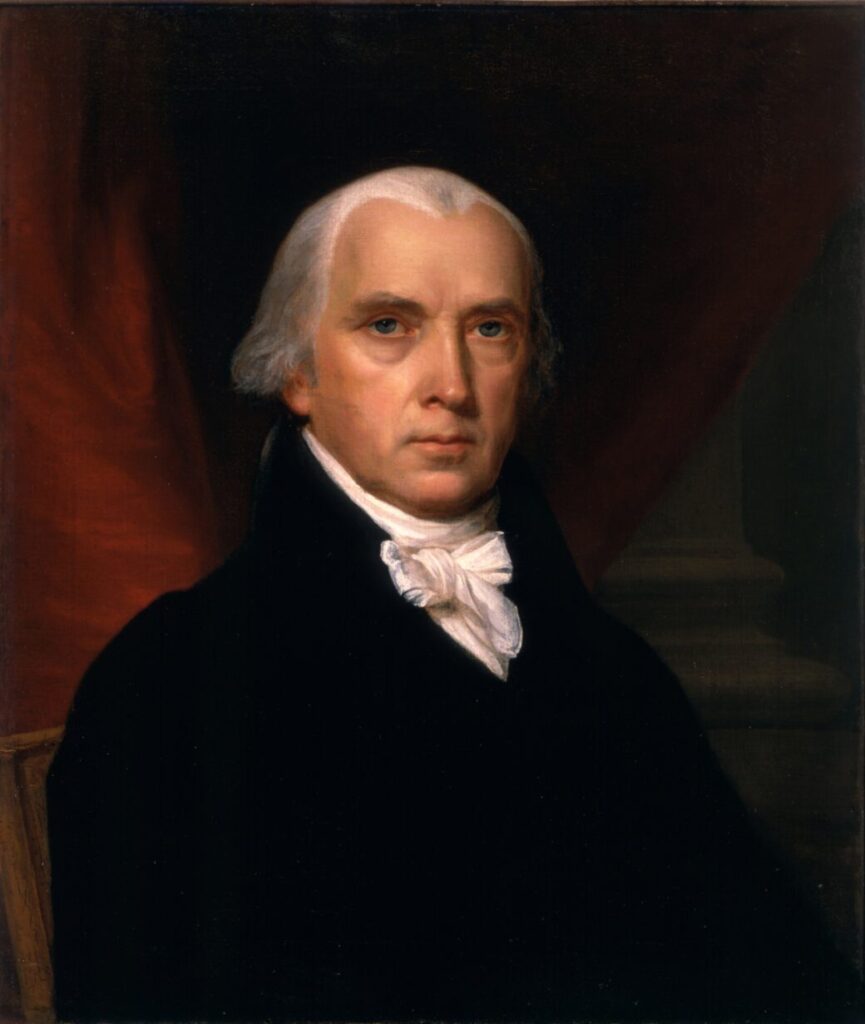
James Madison (The Father of the Constitution):
“The blacks… are a degraded race… It is a great misfortune that they were ever introduced among us.”
—Debates on Missouri Compromise, 1819
This isn’t about hating anyone. It’s about loving your own people enough to tell the truth, no matter how ugly, no matter who calls you names for it. You still have time. But not much. Speak the truth. Protect your family. Reclaim your streets, your schools, your future. Because if you don’t, no one else will. — James Sewell

TL;DR
TL;DR
Black crime emerges as a devastating engine of displacement for Ethnic Americans—the European-descended builders of America’s cities, neighborhoods, and institutions—forcing families to flee the very communities their ancestors forged through generations of labor and sacrifice. Once-peaceful streets now echo with unfamiliar chaos, where a demographic comprising just 13-14% of the population drives disproportionate levels of violence, robbery, and disorder that shatter the social fabric and safety our forefathers established, compelling white flight from urban strongholds like Detroit, Baltimore, and Chicago into ever-receding suburbs. The article confronts suppressed realities head-on: stark disparities in homicide rates, interracial violence overwhelmingly directed against our people, fractured family structures with sky-high out-of-wedlock births, and a cultural glorification of thuggery that perpetuates the cycle—all shielded by taboos that label honest discussion as heresy. Backed by FBI data, victim surveys, and academic studies dismantling excuses of poverty or bias, it frames this not as isolated pathology but as a profound dispossession, eroding our communal bonds, property values, and sense of homeland in the republic we inherited under the 1790 Naturalization Act’s vision. Fellow Ethnic Americans are called to shatter the enforced silence, embrace the arithmetic of survival, build resilient networks, and reclaim our birthright before demographic tides render our posterity permanent minorities in the land our blood and sweat civilized..
© James Sewell 2025 – All rights reserved
Pingback:The Ethnic American Library - Ethnic American