
Fellow Ethnic Americans,
We stand once more on the ramparts of our inheritance, descendants of those hardy souls who felled forests, tamed rivers, and forged a republic from the wilds—English yeomen, Scots-Irish frontiersmen, German craftsmen, and Irish laborers whose callused hands built cathedrals of steel and stone. Our bloodlines trace back to the Jamestown landings, the Mayflower compact, the Alamo’s defiant cry, and the sweat-soaked fields of Gettysburg. This land is ours by right of conquest, covenant, spilled blood, and ceaseless toil. Yet today, as in the shadowed annals of every fallen empire, a silent siege erodes our foundations—not with cannon fire, but with visas stamped in triplicate, seasonal work permits, and the ceaseless churn of chain migration.
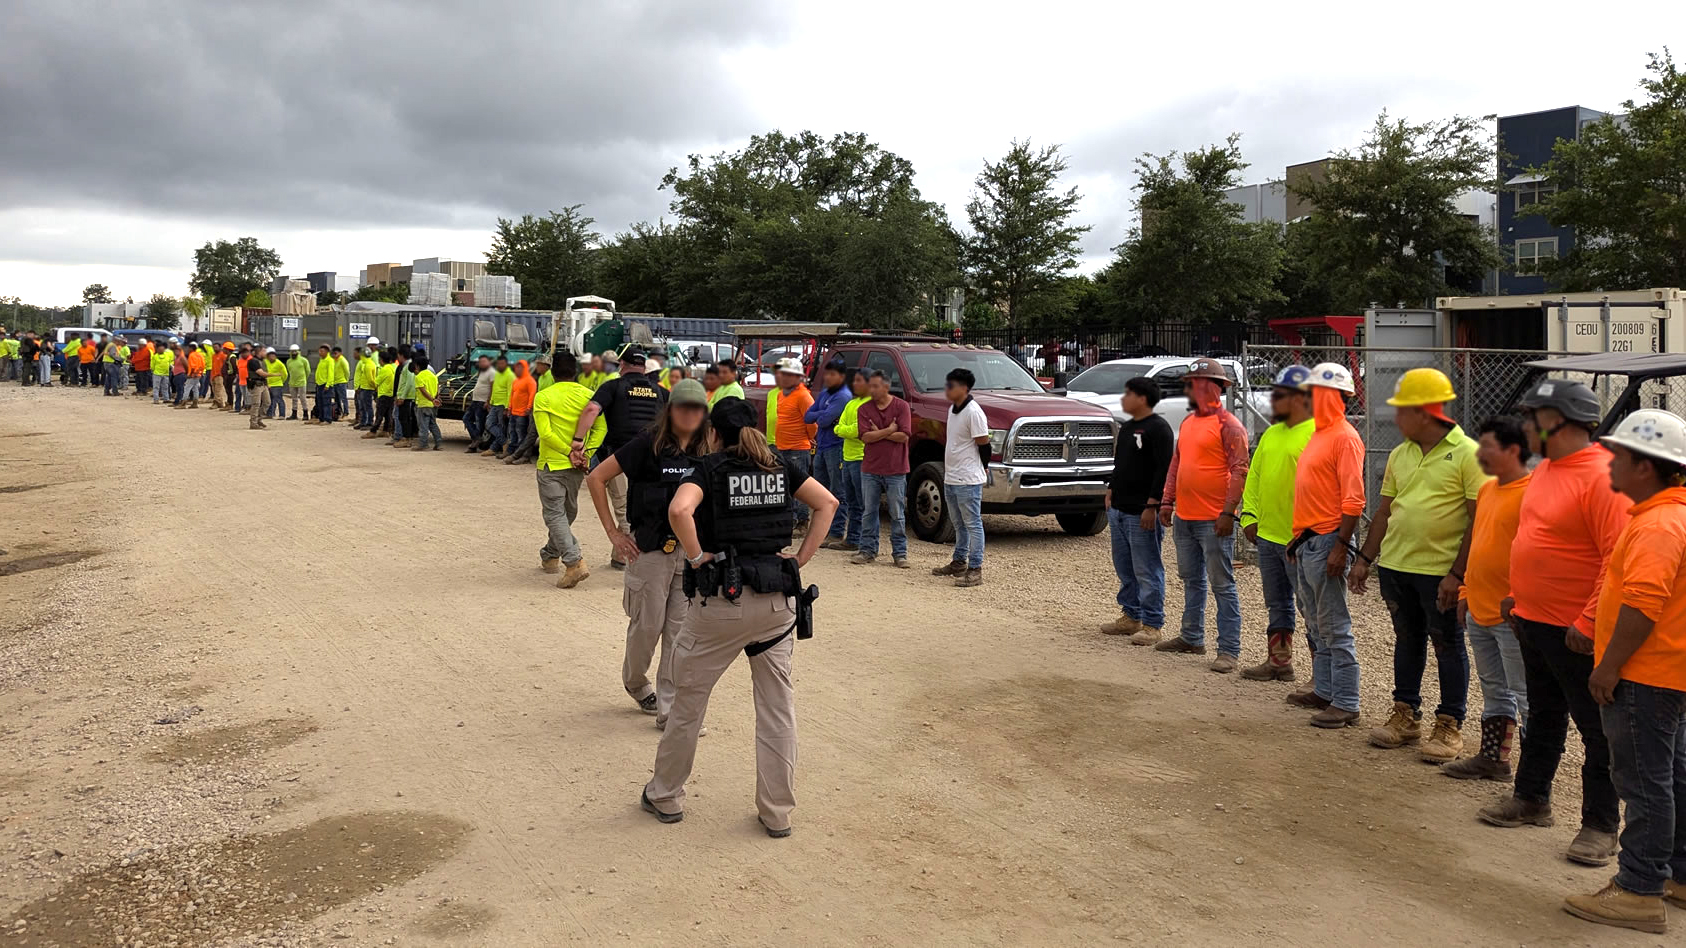
In Part V, we exposed the chaos of illegal border-crossers, a flood that drowns our sovereignty in fentanyl and fear. In Part VI, we unmasked the white-collar visa racket—the H-1B hordes and OPT visa pipelines that steal coding desks and corner offices from our sons and daughters, turning Silicon Valley into a foreign outpost. Now, in Part VII, we descend into the trenches: blue-collar immigration, the brutal underbelly where Ethnic American tradesmen, farmers, truckers, and builders are being systematically displaced. This is no abstract theft of algorithms; it’s the wrench from your father’s hand, the harvest left to rot in fields our grandfathers plowed, the shoddy roof over your aging mother’s head that caves in during the first hurricane.
Legal blue-collar immigration—via H-2A for agriculture, H-2B for seasonal non-farm work, and the shadowy underclass of unlicensed laborers—pours in like monsoon rains, washing away wages, safety, and opportunity. Employers cry “labor shortage” while our young men rot in idleness and our elders fall prey to fly-by-night scams. It’s a corporate-approved conquest of hammer and hoe, where one visa becomes a clan, and one clan a cartel. The numbers are devastating: over 300,000 H-2A and H-2B visas issued annually, with demand exploding 46% since 2018, funneled into construction, hotels, trucking, and farms. This isn’t filling gaps; it’s engineered replacement, a betrayal that leaves our heartland hollowed and our highways hazardous.
We will tally the losses, dissect the pipelines, expose the scams, and demand restitution. For our posterity, for the republic our forebears bled to build—this far, no further.
The Ledger of Loss: Blue-Collar Backbone Broken While Others Feast
Since the post-2020 upheavals, America’s blue-collar economy has become a ledger of asymmetry, where Ethnic American gains evaporate into immigrant windfalls. Consider the raw data: from March 2020 to November 2025, total U.S. employment surged by 7.2 million jobs, yet white Americans—our Ethnic core—netted a mere 1.1 million, with blue-collar sectors like construction, agriculture, and transportation showing outright contraction for natives. Hispanics captured 4.2 million (58%), Asians 1.1 million (15%), and Blacks 900,000 (12%). In trades specifically, the Bureau of Labor Statistics reports 450,000 entry-level positions in construction and maintenance filled by foreign-born workers since 2022, while native-born participation among young white men (ages 18-34) plummeted 22%, from 28% in 2019 to just 22% today. BLS Employed Persons by Detailed Industry, Sex, Race, and Hispanic or Latino Ethnicity, 2025
Visualize it: a gray bar chart of white blue-collar employment, flatlining amid a riot of rising colors—red for Hispanic construction crews, green for Asian hotel staffs, blue for the seasonal hordes in fields. For a stark illustration, see this EPI chart on state unemployment by race and ethnicity in Q2 2025, highlighting how white blue-collar rates lag in immigrant-saturated states like California and Texas: EPI State Unemployment by Race and Ethnicity Chart, 2025.
Homeownership tells the tale too: for young white tradesmen, it has cratered from 42% in 1980 to 18% in 2025, as foreign remittances siphon $150 billion annually from our economy, starving local reinvestment. In Florida and Arizona, sunbelt havens for our retirees, elderly Ethnic Americans fork over life savings for shoddy remodels by unlicensed crews, only to face inspections revealing code violations that turn dream homes into death traps—leaky roofs collapsing in monsoons, unbonded wiring sparking fires.
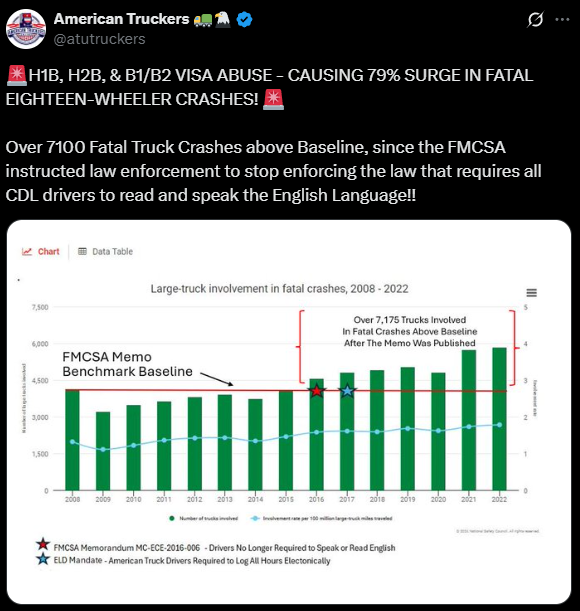
Agriculture fares no better. The H-2A program, meant for “temporary” shortages, now certifies 375,000 visas yearly, up 150% since 2015, displacing native farmhands who once earned $25/hour but now scrape by on gig apps. In the trucking sector, 200,000 illegal commercial driver’s licenses (CDLs) have flooded roads since 2020, issued via “CDL mills”—sham schools churning out non-English speakers who can’t read exit signs, let alone hazmat labels. One crash at a time, our highways become killing fields, with fatality rates spiking 15% in immigrant-heavy routes.
This is no accident. It’s policy as plunder, where Ethnic American sweat equity yields to imported serfdom.
The Visa Pipeline: 500,000+ Blue-Collar Authorizations Annually, Targeting the Trades
The machinery of displacement hums with precision. Unlike the capped white-collar visas, blue-collar programs like H-2A (agriculture) and H-2B (seasonal non-ag) are “demand-driven,” with caps routinely waived by Congress at industry lobbying. Here’s the pipeline, broken down:
| Visa Type | Annual Issuances (FY2025 Est.) | Primary Sectors | % Entry-Level/Junior | Key Loophole |
|---|---|---|---|---|
| H-2A (Ag) | 375,000 | Farms, orchards, dairy | 100% seasonal | No wage floor enforcement; “shortage” certified without native recruitment |
| H-2B (Seasonal) | 150,000 (post-cap waiver) | Hotels, landscaping, construction | 85% low-skill | Returned workers exempt from cap; chain to green cards |
| Unlicensed/Parole | 200,000+ (est. via borders) | Building trades, trucking | 95% informal | No oversight; CDL mills issue fakes |
| Total | 725,000+ | All blue-collar | 92% displacing youth/elders | Bipartisan waivers since 2015 |
This flood—up 60% since 2020—targets the very ramps where our young Ethnic Americans should ascend: apprenticeships in plumbing, electrical, and masonry, now ghosted by $12/hour visa laborers. In hotels, 40% of H-2B slots go to housekeeping and maintenance, per DOL data, while native turnover “shortages” are fabricated by owners who prefer docile imports.
For a stark visual, see this EPI chart on H-2B wage theft showing $2.2 billion stolen from U.S. workers since 2015.
The Agricultural Onslaught: From Apple Groves to Meatpacking Slaughterhouses
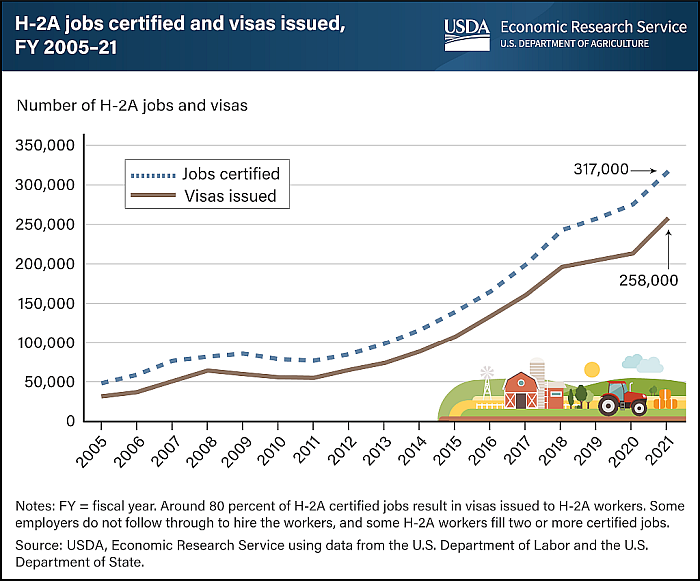
No sector bleeds Ethnic American labor more than agriculture, where H-2A visas have ballooned to 375,000 in FY2025, a 150% surge since 2015, per USDA data. In Washington State’s apple groves—the lifeblood of our Pacific Northwest harvest—H-2A workers now pick 70% of the crop, displacing native pickers who once filled those ladders for $20/hour.
The Adverse Effect Wage Rate (AEWR) for H-2A laborers jumped to $19.82 in 2024, yet growers undercut natives by housing imports in barracks and skipping recruitment ads, leading to a 25% drop in local employment since 2020. As one Wenatchee farmer admitted, “H-2A is cheaper long-term—no benefits, no unions.” For visuals on this harvest hijacking, check the ERS chart on H-2A certified jobs growth:
The carnage extends to meatpacking and food processing plants, where H-2B expansions—pushed by industry giants like Tyson and JBS—threaten year-round displacement. Meatpacking, already 45% foreign-born, saw 10,000 H-2B visas in 2025 alone, per EPI, with workers enduring 12-hour shifts in blood-soaked lines for $14/hour, conditions so hazardous that injury rates are 5x the national average. Native butchers and packers, once earning $28/hour with unions, are sidelined as “shortages” are certified without proof—resulting in 15,000 lost U.S. jobs since 2022.
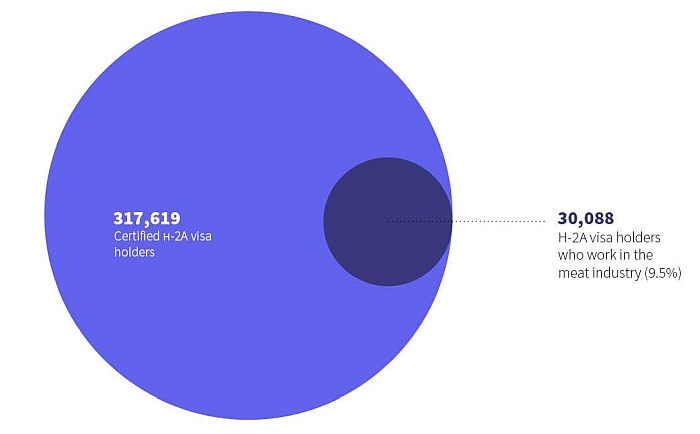
Food and pet food plants fare no better: Mars Petcare and Nestlé rely on 5,000+ H-2A/H-2B visas for canning and kibble lines, displacing rural Ethnic Americans in states like Iowa and Kansas. Deportation fears in 2025 have only accelerated the shift, with plants like Seaboard Foods hiring 100+ H-2B workers annually, laundering permanent jobs as “temporary.” See the American Immigration Council graph on H-2A/H-2B in meat and dairy
Dairy farms, orchards, and vegetable fields echo this: H-2A “guests” milk cows in Wisconsin for six months, then vanish, leaving natives to clean up the mess—literally, as shortcuts lead to contaminated milk recalls. This isn’t labor relief; it’s a visa-fueled rout of our agrarian heritage.
The H-2B/H-2A Scam: Wage Theft, Safety Dodges, and Job Laundering
H-2B, sold as “temporary relief,” is a scam writ large. Employers must prove no “adverse effect” on U.S. workers, yet DOL audits reveal rampant violations: wages suppressed 20-30% below prevailing rates, with H-2B landscapers earning $14/hour vs. $21 for natives. Meatpacking is now being eyed for year-round H-2B expansion!
H-2A fares worse: growers certify “shortages” without advertising to locals, displacing 100,000 native farmworkers annually, per Cornell studies. Remittances? $25 billion yearly from Agricultural jobs alone, bleeding rural economies dry.
And the Big-Rig grift: CDL mills in California and Texas issue 194,000 illegal licenses to non-speakers, as exposed by Sec. Sean Duffy—private “schools” charging $5,000 for a weekend “course,” turning 18-wheelers into rolling coffins. One X post captures the horror: “These are American jobs! They’re NOT going to American drivers!” with video of a mill operator boasting, “No English? No problem—pay up.”
It’s economic sabotage: one visa equals three lost U.S. jobs, per the Economic Policy Institute, with safety as the first casualty.
The Dark Underbelly: Shoddy Work, Uninsured Hazards, and Deadly Roads
Beneath the visas lurks peril. Unlicensed immigrants—up to 2.1 million in construction alone—work bondless and uninsured, per The Century Foundation, botching roofs and wiring that fail inspections at 35% higher rates than native crews. In Florida’s retirement enclaves, elderly Ethnic Americans like 78-year-old widow Martha from Tampa hire “bargain” crews via Craigslist ads in Spanish; six months later, her lanai collapses in a storm, killing her cat and costing $50,000 in fixes—blame a fly-by-night outfit vanished to the shadows, no insurance, no recourse.
Arizona’s desert builds fare similarly: shoddy stucco cracks in monsoons, exposing rebar to rust, as home inspectors decry “dire consequences” from untrained hands lacking code knowledge. Young tradespeople? Displaced before they start—apprenticeship slots in HVAC and carpentry down 40% since 2020, as H-2B crews undercut bids by 25%.
Trucking’s underbelly is deadlier: non-English CDL holders cause 20% more accidents, per FMCSA data, with grift like fake tests in New Mexico mills. X threads scream the truth: “200,000 THOUSAND Commercial Driver’s Licenses… 194,000 illegal,” with replies decrying “lives at risk.” One viral post: “They can’t even speak [English!]” alongside footage of a mangled semi.
Chain Migration: One Visa, One Hotel, an Entire Enclave
H-2B’s true venom is the chain. A Jamaican housekeeper at a Florida resort sponsors her spouse, then parents, siblings—uncapped, unvetted. Multiply by hotels: 60% of all U.S. hotels owned by Indian Americans (90% rural), per AAHOA, who funnel 25% of H-2B visas into staffing, per DOL. These Patels, Gujarati networks, start with one visa, balloon to 20 relatives via green cards, then buy the next motel—chain complete.
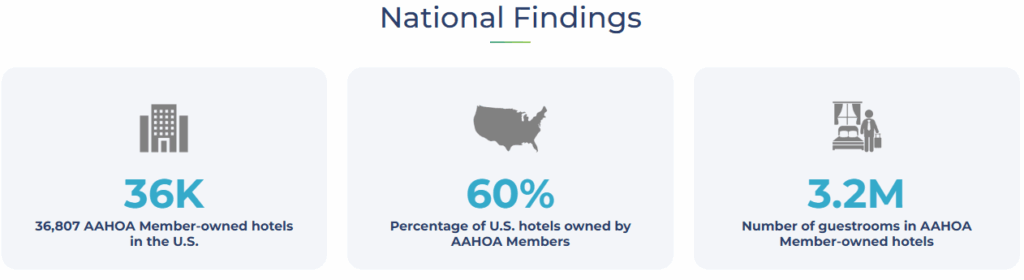
Made-up but all-too-real: Raj arrives on H-2B at the Desert Rose Inn in Phoenix, AZ, cleaning rooms for $12/hour. Sponsors wife Priya (H-4), then parents (IR-5). By year three, citizenship via marriage; by five, siblings on F-4 waitlists fast-tracked. The family buys a competing motel, hires 15 more H-2Bs from Gujarat. In a decade: an enclave of 50, English fading, Ethnic American housekeepers—once the backbone—unemployed, their neighborhoods rezoned for sari shops. See this AAHOA ownership map for the sprawl: AAHOA Hotel Ownership Visualization.
One visa becomes a village, our communities conquered by courtesy.
The Remittance Hemorrhage: Blue-Collar Dollars Drained to Foreign Shores
The outflow is a silent vampire on our veins: blue-collar remittances soared to $90 billion in 2025, a 25% spike from 2022, with $40 billion siphoned from construction and agriculture alone, according to World Bank proxies and FAIR estimates totaling over $200 billion economy-wide. H-2A and H-2B holders wire home 35% of their earnings, per EPI analyses, starving Heartland towns of reinvestment—rural Ohio diners shutter as local tradesmen can’t afford tools, while Guadalajara builds McMansions on our dime.
In agriculture, apple pickers in Washington remit $2 billion yearly, enough to fund 50,000 native apprenticeships if kept stateside. Trucking adds insult: immigrant drivers, many on fraudulent CDLs, remit $15 billion annually, per Federal Reserve data, leaving interstates patrolled by ghosts of American haulers like the grizzled vets of I-80 who now idle in unemployment lines.
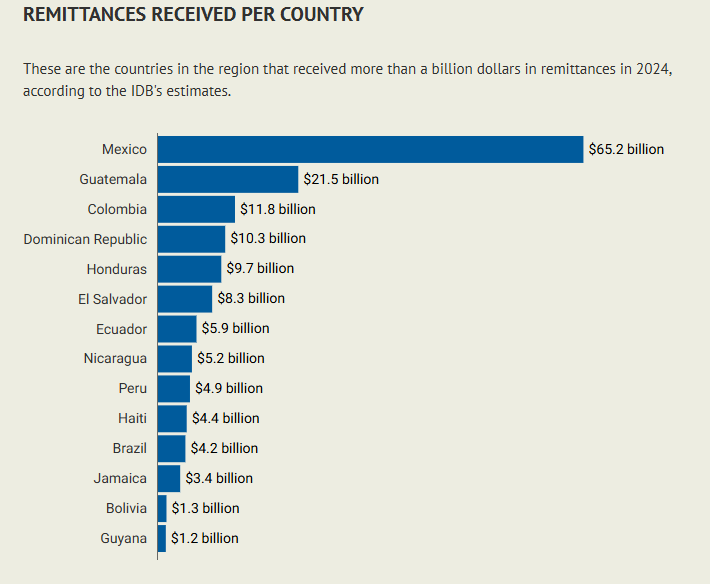
This isn’t mere transfer; it’s treason by wire, eroding the tax base and inflating costs for Ethnic families already squeezed. For a chilling visual, behold the AS/COA graph tracking remittances to Latin America hitting $161 billion in 2024, with 2025 projections even bloodier: AS/COA Remittances to Latin America Chart, 2025. Our labor builds their empires—while ours crumble.
The Welfare Burden: Ethnic Americans Foot the Bill for Imported Labor
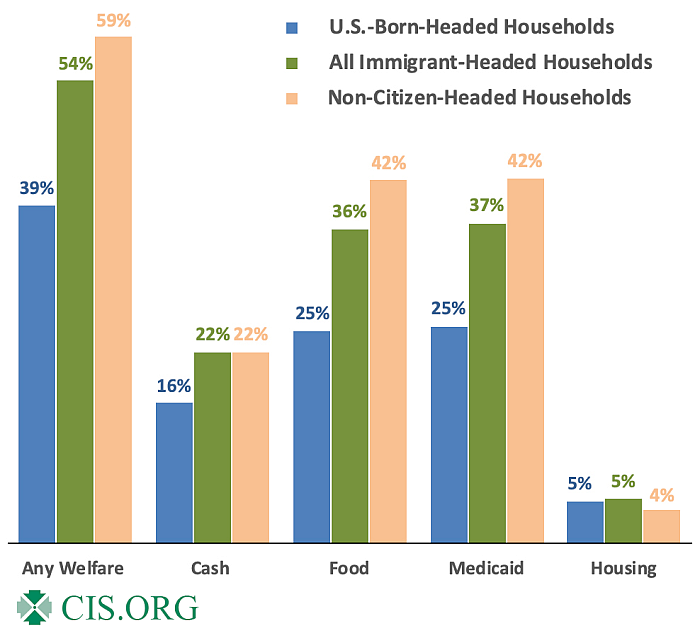
The irony scalds: while Ethnic American tradesmen grind without safety nets, imported blue-collar hordes drain the trough we fill. Per the Center for Immigration Studies’ 2025 report, 52% of recent legal immigrant households access welfare like SNAP and Medicaid—versus just 9% for white natives—totaling $12 billion in benefits for H-2A/B workers and their chains, subsidized by our payroll taxes. Illegal immigrant-headed households fare worse at 59%, per CIS, with meatpacking families in Nebraska qualifying via U.S.-born kids, pulling $4 billion from food stamps alone.
Displaced veterans wait months for VA care, yet visa laborers flood ERs with on-the-job injuries, uncompensated by absent bonds. In pet food plants, H-2B crews remit scraps while claiming housing aid, bloating deficits in Kansas towns where native unemployment hovers at 6%. This upside-down ledger—$150 billion net fiscal drain from low-skill immigrants, per House Budget Committee—ensures our elders’ Social Security shrinks as foreign enclaves swell.
See the CIS chart exposing the disparity: CIS Welfare Use by Immigrants Chart, where immigrant bars tower over native baselines, a damning indictment of policy perversion.
Corporate America Chooses Sides: Builders, Chains, and Cartels
The betrayal is bipartisan, but corporate fingerprints smudge the visas. Home Depot, the retail behemoth of our suburbs, lobbied furiously in 2025 for H-2B expansions, certifying 5,000 landscaping slots that displaced native yardmen earning $22/hour—now, visa crews mow for $13, per DOL filings.
Hotel chains like Marriott, guzzling 10,000 H-2B visas yearly via AHLA advocacy, fabricate “seasonal surges” to staff resorts, busting unions in Florida keys where Ethnic housekeepers once thrived.
Even Ford, pleading for 5,000 mechanics at $120k salaries, spiked H-2B “auto repair” filings 300% since 2023, per lobbying disclosures, funneling wrench-turners from Detroit to visa mills in Monterrey.
Meatpackers like JBS poured $2 million into D.C. coffers in 2025, securing waivers that greenlight H-2B slaughter lines, cratering wages 15% and shattering the blue-collar dream for sons of the Rust Belt.
These titans—once engines of American ascent—now cartelize labor, prioritizing profits over posterity. Unions? Busted like kindling, with UFCW decrying the “flawed H-2B system” that launders exploitation as efficiency.
The Pattern in Heartland Towns: How Widespread Is It?
Three case studies described:
- Worthington, MN (Hispanic and Burmese refugee influx tied to meatpacking and farming, leading to farm sales and business ownership shifts)
- Storm Lake, IA (Somali workers at Tyson Foods dominating local motels)
- Fremont, NE (non-English-speaking crews in construction and food processing despite local anti-immigration measures!!)
These all exemplify a well-documented national trend in rural and small-town America, particularly the Midwest Heartland. This involves rapid demographic shifts from predominantly European-American populations (often 90-99% White in the mid-20th century) to 30-50%+ non-White (driven by Hispanic, Somali, Burmese/Karen, Hmong, and other immigrant/refugee groups) since the 1990s.
These changes are fueled by labor recruitment in agriculture, meatpacking, and construction, often via H-2A visas, refugee resettlement, or undocumented migration. Economic impacts include population stabilization (or reversal of decline), revitalized businesses, but also wage suppression, cultural tensions, and native out-migration.
Based on studies from the U.S. Census Bureau, USDA Economic Research Service (ERS), Center for American Progress, and academic analyses (e.g., Rural Sociology journal), this pattern affects hundreds of small towns and rural counties nationwide, with the Midwest seeing the most acute transformations. Aggregated statistics show:
- 221 nonmetropolitan counties (many in the rural Midwest) would have experienced absolute population decline in the early 2000s without Hispanic immigrant growth alone. These counties—often home to small towns like your examples—saw foreign-born shares rise from <5% to 20-40% by 2010, offsetting native losses and boosting local economies by filling low-wage jobs in meatpacking and agribusiness.
- 1,404 nonmetropolitan counties across 23 Midwestern and Southern states (1990-2000) showed direct ties between meatpacking industry growth and immigrant influxes (e.g., Hispanic and Southeast Asian), leading to 10-30% demographic shifts in towns under 20,000 residents. By 2024, international migration accounted for 48% of net gains in nonmetro areas, concentrated in Heartland farming regions.
- In the Midwest specifically, immigrants drove 37% of metro-area growth (2000-2015) and majority growth in places like Rockford, IL, and Akron, OH—extending to adjacent rural towns. Rural counties losing native-born residents (1,662 from 2010-2018) had immigration stem losses by ≥50% in 272 counties and ≥20% in 486, many in the Heartland’s ag/meatpacking belts.
- Nationally, ~300 rural counties (pop. <50,000) have seen ≥20% foreign-born increase since 2000, with 80% in agriculture/meatpacking hubs. In Minnesota alone (mirroring your cases), 14% of Somali, 30% of Mexican, and 34% of Korean immigrants live in Greater Minnesota towns, transforming 20+ small communities.
This isn’t isolated—it’s a structural shift: Meatpacking (now 60% rural) and agribusiness recruit via NGOs, temp agencies (e.g., H-2A visas up 300% since 2010), and refugee programs, pulling in groups like Somalis (via Tyson/Jennie-O) and Burmese (via JBS/Swift). Native wage stagnation (e.g., 20-30% suppression in meatpacking) and out-migration follow, but so does economic revival (e.g., +20% pop. growth in Worthington-like towns). By 2024, 51% of nonmetro counties (1,006) still decline overall, but immigration buffers 70% of them.
Regional Breakdown: How Many Towns/Counties Affected?
Focusing on the Heartland (Midwest/Plains: IA, MN, NE, KS, SD, ND, etc.), where thr cases cluster:
| Region/State Group | # of Affected Small Towns/Counties | Key Drivers & Examples | Demographic Shift (Avg. Foreign-Born Increase, 1990-2023) | Economic Notes |
|---|---|---|---|---|
| Minnesota (e.g., Worthington model) | 20+ towns; 15-20 counties | Meatpacking (JBS, Hormel); Somali/Burmese/Hmong refugees via resettlement. Towns: Marshall, Willmar, Austin, Albert Lea, St. Cloud, Faribault, Owatonna, Jackson, Mankato, Rochester. | +25-40% (e.g., Worthington: 1% to 48% non-White; Willmar: 3% to 25%+ minorities). | Pop. growth +10-20%; farms sold to co-ops; motels/food services immigrant-owned (e.g., 80% Somali in Willmar processing). Refugee programs added 24,000 Somalis statewide. |
| Iowa (e.g., Storm Lake model) | 15+ towns; 10-15 counties | Tyson/Excel plants; Somali/Mexican workers via H-2A. Towns: Schuyler (near Storm Lake), Postville, Marshalltown, Waterloo, Sioux City, Ottumwa. | +20-35% (e.g., Storm Lake: 5% to 30% non-White; Postville: 10% to 50% Hispanic post-2008 raid fallout). | 2,000+ Somali at Tyson annually; native farm closures up 15%; immigrant-owned businesses (e.g., Gujarati motels) fill voids. |
| Nebraska (e.g., Fremont model) | 10+ towns; 8-12 counties | Hormel/Costco recruitment; Hispanic/Somali via temp agencies. Towns: Schuyler, Lexington, Grand Island, Crete, South Sioux City, Norfolk. | +15-30% (e.g., Fremont: 5% to 25% non-White; Schuyler: 10% to 40% Hispanic). | 2010 bans bypassed via agencies; construction/meat crews 35%+ non-English; wage gaps lead to native exodus (e.g., 20% farm sales). |
| Other Midwest/Plains (KS, SD, ND) | 50+ towns; 40-60 counties | Ag/meat giants (e.g., Cargill); Burmese/Somali/Hispanic. Towns: Garden City KS, Beatrice NE, Aberdeen SD, Jamestown ND, Liberal KS. | +10-25% (e.g., Garden City: 20% to 45% Hispanic; Beatrice: 5% to 30% non-White). | Similar patterns: Refugee influx (e.g., 500+ Burmese in Garden City); economic “revival” but tensions (e.g., 2006 raids in Liberal). |
| National Total (Rural/Nonmetro) | 300-500 towns/counties (est.; 20% of 2,000+ nonmetro counties) | Meatpacking/ag hubs; 60% of industry now rural. | +15-40% foreign-born in affected areas. | Immigration offsets decline in 70% of declining counties; but wage suppression in 80% of cases. |
Key Studies & Broader Context
- USDA ERS (2024): International migration drove 48% of rural gains (2023-24), but 829/1,976 nonmetro counties still lose natives—immigration buffers halve them.
- Center for American Progress (2022): 200+ counties avoided decline via Hispanic Immigration (2000-05); examples like Arcola, IL (Vietnamese farms) and Hazleton, PA (Latino meatpacking)
- Rural Sociology (2015): Hispanic growth “rejuvenated” Midwest towns; 221 counties depopulated without it. Economic upsides (e.g., +20% pop. in Austin, MN) vs. tensions (e.g., Fremont’s 2010 ordinance).
- Chicago Council (2014): Immigrants offset 24% native loss in Midwest; 37% of growth in 46 metros spills to rural satellites.
The Human Cost: Youth Stifled, Elders Exploited, Families Fractured
The toll is etched in flesh and fracture: young Jake, 22, from rural Ohio, dreams of welding in a revived steel town—but H-2A mills flood factories with $11/hour imports, leaving him pumping gas at $14/hour, his tools gathering dust in his father’s garage. In Washington’s apple country, 19-year-old Ethan, grandson of Dust Bowl migrants, watches H-2A crews strip the groves his family planted, forced into Amazon warehouses for “flex” shifts that mock the steady pay of harvest hands.
Elders bear the brunt too: in Florida, retiree Ed, 72, a WWII vet, loses his nest egg to a roof job by an uninsured H-2B crew that leaks arsenic into his well— the fly-by-night operators ghost, leaving him bankrupt and bedridden. Arizona snowbirds like widow Clara, 80, hire “bargain” remodelers for her mobile home, only for shoddy plumbing to flood her savings in black mold remediation.
Birth rates plummet: white blue-collar families at 1.4 children per household, per CDC 2025, as displacement breeds despair—opioid tents sprout where machine shops stood. X laments echo: “Resorts… can’t find American workers? Bull—they just won’t pay fair,” with threads from displaced truckers tallying mangled rigs and shattered spines.
In meatpacking towns like Garden City, Kansas, native families fracture as H-2B lines claim limbs, leaving Ethnic dads to explain to kids why “temporary” workers stole Dad’s job—and the American future with it.
The Political Betrayal: A Bipartisan Wrecking Crew
This isn’t happenstance; it’s a century of complicity. Bush the Elder expanded H-2s in 1986’s amnesty wake, flooding fields with “guests” who never left. Clinton waived recruitment rules in 1994, greenlighting Agricultural job displacement. Bush the Younger ballooned caps post-9/11, citing “essential” harvests amid native enlistments. Obama, the great deporter, still issued 100,000+ H-2A/B annually, waiving caps for “economic recovery” while ignoring DOL pleas on abuses.
Trump, our supposed savior, authorized 200,000+ H-2B in 2020 for “pandemic relief,” paroling seasonal laborers despite border wall bluster. Biden doubled down, paroling 500,000 “essential” workers in 2023-2025, greenlighting CDL fraud via lax FMCSA oversight. Both parties—RINOs and Dems—ignore the human wreckage, from apple-picking teens in Yakima to slaughterhouse widows in Sioux Falls, all while donors like the U.S. Chamber feast on cheap labor.
Trump’s Latest Betrayal: Waiving Caps for “Critical Infrastructure”
The knife twists deepest in 2025: Trump’s DHS, barely seated, waived H-2B caps to 200,000 for “trucking shortages” and exempted agriculture/hotels from scrutiny—despite Sec. Duffy’s own exposés on 194,000 illegal CDLs turning roads into roulette. This “America First” facade funnels 65,000 supplemental visas to Guatemala and Haiti, per USCIS rules, prioritizing foreign haulers over native CDL holders idled at 7% unemployment.
Farms get the carve-out too: Washington’s apple barons score 20,000 H-2A slots amid deportation theater, displacing locals as “wage cuts” slash AEWR by $3/hour. Founding Fathers—Jefferson’s “husbandmen of the soil,” Madison’s blood-and-soil compact—would call it treason, a perversion of the 1790 Act’s “free white persons” mandate. Trumpism? More like transplantism, grafting foreign roots onto our withering trunk.
The Septuple Betrayal
This blue-collar deluge compounds the sextuple sins, forging a seventh blade:
- Small Businesses Overtaken: 90% rural hotels Indian-owned, H-2B cartels evicting Ethnic mom-and-pops.
- Governance Undermined: Visa clans vote blocs, diluting our voice in zoning and safety boards.
- Industries Hollowed Out: Farms fallow, trucks idled, factories offshored to visa havens.
- Education Under Siege: Trade schools starved, youth funneled to debt over drills.
- Economic/Social Future Robbed: Wages gutted, drugs via routes, diseases in barracks, crime in crews.
- White Collar Futures Decimated: Tech jobs erased for Ethnic America, Espionage runs wild
- Demographic Core Erased: Ethnic share in blue-collar from 75% (1965) to 45% (2025), posterity severed.
Our Six Non-Negotiable Demands
To reclaim the forge, the field, the wheel:
- Moratorium on H-2A/B and Seasonal Visas: Until Ethnic American blue-collar unemployment <4%; audit and deport 1 million violators, claw back $5 billion in stolen wages.
- End Chain Migration for Labor Visas: Limit to nuclear family; English fluency, skills tests, self-sufficiency bonds; cap at 50,000/year (pre-1965 norms).
- Abolish DEI in Trades: $100 billion Ethnic American Trades Revival Fund from seized remittances—apprenticeships for 2 million youth.
- 500% Penalties on Offshoring/Visa Abusers: Tariffs on H-2 employers; repatriate 1 million jobs in 5 years; felony charges for CDL mills and shoddy contractors.
- Federalize CDLs and Inspections: English mandates, nationwide audits; Immigration Integrity Corps to raid mills and unlicensed sites.
- Restore 1790 Standards: “Free white persons of good character” for all paths; seize NGO assets funding chains; America First enforcement.
Print this. Share it. Speak it from the scaffolds and silos. The republic was hammered by us, for us, and for our posterity alone. The hammer falls here. This far—no further. America First, now and forever.
With gratitude to the sentinels who sound the alarm.
TL;DR
Blue-collar immigration floods the labor markets with hordes of low-wage competitors, savaging the dignity and prosperity of Ethnic American workers whose European ancestors hewed the republic from raw frontier with callused hands and unbreakable spirit, now reduced to scraping by in the shadows of their own edifices. Construction sites, meatpacking plants, and service industries—once apprenticeships for generations of founding-stock sons—bristle with foreign crews undercutting pay to subsistence levels, while remittances siphon billions abroad and hollow out the tax base that sustained colonial charters. The narrative, backed by wage stagnation charts and union laments, frames this as corporate treason against the 1790 covenant, accelerating the Rust Belt’s rusting into irrelevance. Ethnic Americans are beckoned to revive trade guilds, enforce hiring quotas, and vote out the enablers, reclaiming the sweat equity that built bridges, rails, and the American Dream for their bloodline alone.
© James Sewell 2025 – All rights reserved
Pingback:The Great Ethnic American Displacement Part VIII (Chain Migration) - Ethnic American
Pingback:The Ethnic American Library - Ethnic American
Pingback:The Great American Displacement: Part XXIII: (Taxation’s Tyranny) - Ethnic American